Philips 2008 Annual Report Download - page 263
Download and view the complete annual report
Please find page 263 of the 2008 Philips annual report below. You can navigate through the pages in the report by either clicking on the pages listed below, or by using the keyword search tool below to find specific information within the annual report.-
 1
1 -
2
-
3
-
4
-
5
-
6
-
7
-
8
-
9
-
10
-
11
-
12
-
13
-
14
-
15
-
16
-
17
-
18
-
19
-
20
-
21
-
22
-
23
-
24
-
25
-
26
-
27
-
28
-
29
-
30
-
31
-
32
-
33
-
34
-
35
-
36
-
37
-
38
-
39
-
40
-
41
-
42
-
43
-
44
-
45
-
46
-
47
-
48
-
49
-
50
-
51
-
52
-
53
-
54
-
55
-
56
-
57
-
58
-
59
-
60
-
61
-
62
-
63
-
64
-
65
-
66
-
67
-
68
-
69
-
70
-
71
-
72
-
73
-
74
-
75
-
76
-
77
-
78
-
79
-
80
-
81
-
82
-
83
-
84
-
85
-
86
-
87
-
88
-
89
-
90
-
91
-
92
-
93
-
94
-
95
-
96
-
97
-
98
-
99
-
100
-
101
-
102
-
103
-
104
-
105
-
106
-
107
-
108
-
109
-
110
-
111
-
112
-
113
-
114
-
115
-
116
-
117
-
118
-
119
-
120
-
121
-
122
-
123
-
124
-
125
-
126
-
127
-
128
-
129
-
130
-
131
-
132
-
133
-
134
-
135
-
136
-
137
-
138
-
139
-
140
-
141
-
142
-
143
-
144
-
145
-
146
-
147
-
148
-
149
-
150
-
151
-
152
-
153
-
154
-
155
-
156
-
157
-
158
-
159
-
160
-
161
-
162
-
163
-
164
-
165
-
166
-
167
-
168
-
169
-
170
-
171
-
172
-
173
-
174
-
175
-
176
-
177
-
178
-
179
-
180
-
181
-
182
-
183
-
184
-
185
-
186
-
187
-
188
-
189
-
190
-
191
-
192
-
193
-
194
-
195
-
196
-
197
-
198
-
199
-
200
-
201
-
202
-
203
-
204
-
205
-
206
-
207
-
208
-
209
-
210
-
211
-
212
-
213
-
214
-
215
-
216
-
217
-
218
-
219
-
220
-
221
-
222
-
223
-
224
-
225
-
226
-
227
-
228
-
229
-
230
-
231
-
232
-
233
-
234
-
235
-
236
-
237
-
238
-
239
-
240
-
241
-
242
-
243
-
244
-
245
-
246
-
247
-
248
-
249
-
250
-
251
-
252
-
 253
253 -
 254
254 -
 255
255 -
 256
256 -
 257
257 -
 258
258 -
 259
259 -
 260
260 -
 261
261 -
 262
262 -
 263
263 -
 264
264 -
 265
265 -
 266
266 -
 267
267 -
 268
268 -
 269
269 -
 270
270 -
 271
271 -
 272
272 -
 273
273 -
274
-
275
-
276
 |
 |

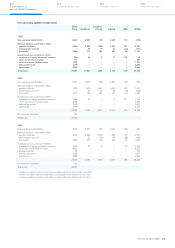
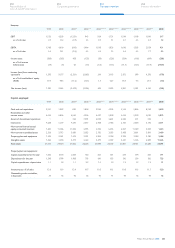
Income
1999 2000 20011) 20021) 2) 20031) 2) 3) 4) 20041) 2) 3) 4) 2005
1) 2) 3) 4) 20061) 2) 3) 4) 20073) 4) 2008
EBIT 1,553 4,258 (1,251) 943 924 1,731 1,549 1,198 1,841 317
as a % of sales 4.9 11.2 (3.9) 3.5 3.9 7.1 6.1 4.5 6.9 1.2
EBITA 1,768 4,600 (810) 1,464 1,018 1,836 1,643 1,383 2,054 931
as a % of sales 5.6 12.1 (2.6) 5.5 4.3 7.5 6.5 5.2 7.7 3.5
Income taxes (208) (563) 428 (133) (38) (226) (524) (166) (619) (286)
as a % of income
before taxes (14) (9) 20 (10) (5.6) (11.6) (31.7) (13.5) (13.9) (310.9)
Income (loss) from continuing
operations 1,595 9,577 (2,331) (2,863) 219 3,163 2,872 899 4,593 (178)
as a % of stockholders’ equity
(ROE) 10.9 48.5 (11.2) (15.3) 1.7 22.7 18.4 4.3 21.0 (1.0)
Net income (loss) 1,590 9,662 (2,475) (3,206) 695 2,835 2,861 5,381 4,160 (186)
Capital employed
1999 2000 20011) 20021) 2) 20031) 2) 3) 20041) 2) 3) 4) 20051) 2) 3) 4) 20061) 2) 3) 4) 2007
3) 4) 2008
Cash and cash equivalents 2,331 1,089 890 1,858 2,946 4,205 5,143 5,886 8,769 3,620
Receivables and other
current assets 6,453 6,806 6,540 4,906 4,437 5,028 5,436 5,990 5,690 5,875
Assets of discontinued operations −−426 7,381 6,838 4,661 4,484 431 333 −
Inventories 4,268 5,279 4,240 2,817 2,468 2,466 2,753 2,834 3,146 3,371
Non-current financial assets/
equity-accounted investees 7,400 11,306 11,033 4,995 4,096 6,235 6,067 11,029 5,069 1,615
Non-current receivables/assets 2,326 2,713 3,080 2,823 2,782 3,035 3,438 3,661 3,810 3,400
Property, plant and equipment 7,332 9,041 7,474 3,001 2,843 2,768 2,999 3,084 3,180 3,484
Intangible assets 1,563 3,290 5,519 4,424 2,579 2,307 3,541 5,536 6,289 11,676
Total assets 31,673 39,524 39,202 32,205 28,989 30,705 33,861 38,451 36,286 33,041
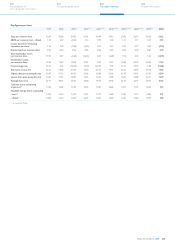
Property, plant and equipment:
Capital expenditures for the year 1,662 3,170 2,069 720 663 661 637 694 661 771
Depreciation for the year 1,548 1,789 1,908 795 641 635 542 554 562 725
Capital expenditures : depreciation 1.1 1.8 1.1 0.9 1.0 1.0 1.2 1.3 1.2 1.1
Inventories as a % of sales 13.6 13.9 13.4 10.7 10.5 10.1 10.8 10.6 11.7 12.8
Outstanding trade receivables,
in days sales 39 42 42 36 43 41 44 45 44 42
Philips Annual Report 2008 263
254
Corporate governance
250
Reconciliation of
non-US GAAP information
262
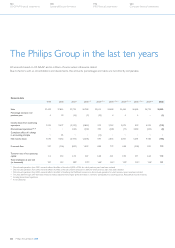
Ten-year over view
266
Investor information