Philips 2008 Annual Report Download - page 190
Download and view the complete annual report
Please find page 190 of the 2008 Philips annual report below. You can navigate through the pages in the report by either clicking on the pages listed below, or by using the keyword search tool below to find specific information within the annual report.-
 1
1 -
2
-
3
-
4
-
5
-
6
-
7
-
8
-
9
-
10
-
11
-
12
-
13
-
14
-
15
-
16
-
17
-
18
-
19
-
20
-
21
-
22
-
23
-
24
-
25
-
26
-
27
-
28
-
29
-
30
-
31
-
32
-
33
-
34
-
35
-
36
-
37
-
38
-
39
-
40
-
41
-
42
-
43
-
44
-
45
-
46
-
47
-
48
-
49
-
50
-
51
-
52
-
53
-
54
-
55
-
56
-
57
-
58
-
59
-
60
-
61
-
62
-
63
-
64
-
65
-
66
-
67
-
68
-
69
-
70
-
71
-
72
-
73
-
74
-
75
-
76
-
77
-
78
-
79
-
80
-
81
-
82
-
83
-
84
-
85
-
86
-
87
-
88
-
89
-
90
-
91
-
92
-
93
-
94
-
95
-
96
-
97
-
98
-
99
-
100
-
101
-
102
-
103
-
104
-
105
-
106
-
107
-
108
-
109
-
110
-
111
-
112
-
113
-
114
-
115
-
116
-
117
-
118
-
119
-
120
-
121
-
122
-
123
-
124
-
125
-
126
-
127
-
128
-
129
-
130
-
131
-
132
-
133
-
134
-
135
-
136
-
137
-
138
-
139
-
140
-
141
-
142
-
143
-
144
-
145
-
146
-
147
-
148
-
149
-
150
-
151
-
152
-
153
-
154
-
155
-
156
-
157
-
158
-
159
-
160
-
161
-
162
-
163
-
164
-
165
-
166
-
167
-
168
-
169
-
170
-
171
-
172
-
173
-
174
-
175
-
176
-
177
-
178
-
179
-
 180
180 -
 181
181 -
 182
182 -
 183
183 -
 184
184 -
 185
185 -
 186
186 -
 187
187 -
 188
188 -
 189
189 -
 190
190 -
 191
191 -
 192
192 -
 193
193 -
 194
194 -
 195
195 -
 196
196 -
 197
197 -
 198
198 -
 199
199 -
 200
200 -
201
-
202
-
203
-
204
-
205
-
206
-
207
-
208
-
209
-
210
-
211
-
212
-
213
-
214
-
215
-
216
-
217
-
218
-
219
-
220
-
221
-
222
-
223
-
224
-
225
-
226
-
227
-
228
-
229
-
230
-
231
-
232
-
233
-
234
-
235
-
236
-
237
-
238
-
239
-
240
-
241
-
242
-
243
-
244
-
245
-
246
-
247
-
248
-
249
-
250
-
251
-
252
-
253
-
254
-
255
-
256
-
257
-
258
-
259
-
260
-
261
-
262
-
263
-
264
-
265
-
266
-
267
-
268
-
269
-
270
-
271
-
272
-
273
-
274
-
275
-
276
 |
 |

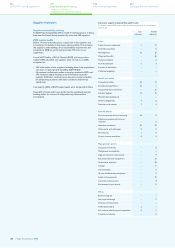
Global Reporting Initiative (GRI): G3 performance indicators
The Philips Annual Report 2008 covers our financial, social and environmental performance in a single volume. This chart provides you with a view
of performance indicators covered in the report. Because we report at Philips Group level, performance indicators on local issues are not adressed.
not
applicable addressed
not
addressed
page
number
Economic
Economic performance EC1 Direct economic value generated and distributed, including revenues, operating costs,
employee compensation, donations and other community investments, retained earnings,
and payments to capital providers and governments
✓
124-178
EC2 Financial implications and other risks and opportunities for the organization’s activities
due to climate change
✓ 26-29,
180-185
EC3 Coverage of the organization’s defined-benefit plan obligations ✓
160-163
EC4 Significant financial assistance received from government ✓
EC6 Policy, practices, and proportion of spending on locally-based suppliers at significant
locations of operation
✓
EC7 Procedures for local hiring and proportion of senior management hired from the local
community at significant locations of operation
✓37, 64,
187
EC8 Development and impact of infrastructure investments and services provided primarily
for public benefit through commercial, in-kind, or pro bono engagement
✓33, 65
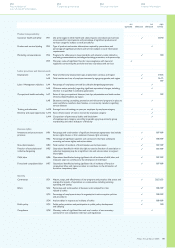
Environment
Materials EN1 Materials used by weight or volume ✓
EN2 Percentage of materials used that are recycled input materials ✓
Energy EN3 Direct energy consumption by primary energy source ✓
EN4 Indirect energy consumption by primary source ✓
Water EN8 Total water withdrawal by source ✓185
Biodiversity EN11 Location and size of land owned, leased, managed in, or adjacent to, protected
areas and areas of high biodiversity value outside protected areas
✓
EN12 Description of significant impacts of activities, products, and services on
biodiversity in protected areas and areas of high biodiversity value outside
protected areas
✓
Emissions, effluents, and waste EN16 Total direct and indirect greenhouse gas emissions by weight ✓185
EN17 Other relevant indirect greenhouse gas emissions by weight ✓184
EN19 Emissions of ozone-depleting substances by weight ✓186
EN20 NOx, SOx, and other significant air emissions by type and weight ✓
EN21 Total water discharge by quality and destination ✓
EN22 Total weight of waste by type and disposal method ✓185
EN23 Total number and volume of significant spills ✓186
EN26 Initiatives to mitigate environmental impacts of products and services, and
extent of impact mitigation
✓38-40, 183
EN27 Percentage of products sold and their packaging materials that are
reclaimed by category
✓
Compliance EN28 Monetary value of significant fines and total number of non-monetary
sanctions for non-compliance with environmental laws and regulations
✓
Philips Annual Report 2008190
180
Sustainability performance
Global Reporting Initiative
192
IFRS financial statements
244
Company financial statements
124
US GAAP financial statements