Philips 2008 Annual Report Download - page 45
Download and view the complete annual report
Please find page 45 of the 2008 Philips annual report below. You can navigate through the pages in the report by either clicking on the pages listed below, or by using the keyword search tool below to find specific information within the annual report.-
 1
1 -
2
-
3
-
4
-
5
-
6
-
7
-
8
-
9
-
10
-
11
-
12
-
13
-
14
-
15
-
16
-
17
-
18
-
19
-
20
-
21
-
22
-
23
-
24
-
25
-
26
-
27
-
28
-
29
-
30
-
31
-
32
-
33
-
34
-
 35
35 -
 36
36 -
 37
37 -
 38
38 -
 39
39 -
 40
40 -
 41
41 -
 42
42 -
 43
43 -
 44
44 -
 45
45 -
 46
46 -
 47
47 -
 48
48 -
 49
49 -
 50
50 -
 51
51 -
 52
52 -
 53
53 -
 54
54 -
 55
55 -
56
-
57
-
58
-
59
-
60
-
61
-
62
-
63
-
64
-
65
-
66
-
67
-
68
-
69
-
70
-
71
-
72
-
73
-
74
-
75
-
76
-
77
-
78
-
79
-
80
-
81
-
82
-
83
-
84
-
85
-
86
-
87
-
88
-
89
-
90
-
91
-
92
-
93
-
94
-
95
-
96
-
97
-
98
-
99
-
100
-
101
-
102
-
103
-
104
-
105
-
106
-
107
-
108
-
109
-
110
-
111
-
112
-
113
-
114
-
115
-
116
-
117
-
118
-
119
-
120
-
121
-
122
-
123
-
124
-
125
-
126
-
127
-
128
-
129
-
130
-
131
-
132
-
133
-
134
-
135
-
136
-
137
-
138
-
139
-
140
-
141
-
142
-
143
-
144
-
145
-
146
-
147
-
148
-
149
-
150
-
151
-
152
-
153
-
154
-
155
-
156
-
157
-
158
-
159
-
160
-
161
-
162
-
163
-
164
-
165
-
166
-
167
-
168
-
169
-
170
-
171
-
172
-
173
-
174
-
175
-
176
-
177
-
178
-
179
-
180
-
181
-
182
-
183
-
184
-
185
-
186
-
187
-
188
-
189
-
190
-
191
-
192
-
193
-
194
-
195
-
196
-
197
-
198
-
199
-
200
-
201
-
202
-
203
-
204
-
205
-
206
-
207
-
208
-
209
-
210
-
211
-
212
-
213
-
214
-
215
-
216
-
217
-
218
-
219
-
220
-
221
-
222
-
223
-
224
-
225
-
226
-
227
-
228
-
229
-
230
-
231
-
232
-
233
-
234
-
235
-
236
-
237
-
238
-
239
-
240
-
241
-
242
-
243
-
244
-
245
-
246
-
247
-
248
-
249
-
250
-
251
-
252
-
253
-
254
-
255
-
256
-
257
-
258
-
259
-
260
-
261
-
262
-
263
-
264
-
265
-
266
-
267
-
268
-
269
-
270
-
271
-
272
-
273
-
274
-
275
-
276
 |
 |

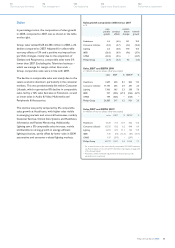
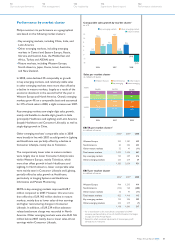
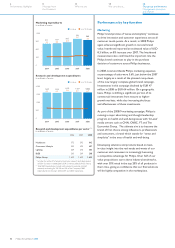
Sales
In percentage terms, the composition of sales growth
in 2008, compared to 2007, was as shown in the table
on the right.
Group sales totaled EUR 26,385 million in 2008, a 2%
decline compared to 2007. Adjusted for unfavorable
currency effects of 3% and a positive net impact from
portfolio changes, mainly due to the acquisition of
Genlyte and Respironics, comparable sales were 3%
lower than 2007. Excluding the Television business –
which we manage for margin rather than scale –
Group comparable sales were in line with 2007.
The decline in comparable sales was mainly due to the
severe economic downturn, particularly in the consumer
markets. This was predominantly felt within Consumer
Lifestyle, which reported an 8% decline in comparable
sales, led by a 12% sales decrease at Television, as well
as lower sales in Audio & Video Multimedia and
Peripherals & Accessories.
This decline was partly tempered by 6% comparable
sales growth at Healthcare, with higher sales visible
in emerging markets and across all businesses, notably
Customer Services, Clinical Care Systems, and Healthcare
Informatics and Patient Monitoring. Additionally,
Lighting saw a 3% comparable sales increase, mainly
attributable to strong growth in energy-efficient
lighting solutions, partly offset by lower sales in OEM
automotive and consumer-related lighting markets.
Sales growth composition 2008 versus 2007
in %
com-
parable
growth
currency
effects
consoli-
dation
changes
nominal
growth
Healthcare 5.6 (4.5) 14.1 15.2
Consumer Lifestyle (8.5) (2.7) (5.2) (16.4)
Lighting 2.6 (3.8) 17.8 16.6
I&EB (26.6) (0.9) (9.6) (37.1)
GM&S (24.2) (0.5) −(24.7)
Philips Group (2.7) (3.3) 4.5 (1.5)
Sales, EBIT and EBITA 2008
in millions of euros unless otherwise stated
sales EBIT % EBITA1) %
Healthcare 7,649 638 8.3 863 11.3
Consumer Lifestyle 11,145 265 2.4 281 2.5
Lighting 7,106 165 2.3 538 7.6
I&EB 337 (226) (67.1) (226) (67.1)
GM&S 148 (525) −(525) −
Philips Group 26,385 317 1.2 931 3.5
Sales, EBIT and EBITA 20072)
in millions of euros unless otherwise stated
sales EBIT % EBITA1) %
Healthcare 6,638 713 10.7 862 13.0
Consumer Lifestyle 13,330 832 6.2 848 6.4
Lighting 6,093 675 11.1 722 11.9
I&EB 535 (82) (15.3) (81) (15.1)
GM&S 197 (297) −(297) −
Philips Group 26,793 1,841 6.9 2,054 7.7
For a reconciliation to the most directly comparable US GAAP measures,
1)
see Reconciliation of non-US GAAP information that begins on page 250
of this Annual Report
Revised to reflect immaterial adjustments of intercompany profit
2)
eliminations on inventories
Philips Annual Report 2008 45
122
Performance statements
114
Supervisory Board report
110
Our leadership
94
Risk management
70
Our sector performance