Philips 2008 Annual Report Download - page 51
Download and view the complete annual report
Please find page 51 of the 2008 Philips annual report below. You can navigate through the pages in the report by either clicking on the pages listed below, or by using the keyword search tool below to find specific information within the annual report.-
 1
1 -
2
-
3
-
4
-
5
-
6
-
7
-
8
-
9
-
10
-
11
-
12
-
13
-
14
-
15
-
16
-
17
-
18
-
19
-
20
-
21
-
22
-
23
-
24
-
25
-
26
-
27
-
28
-
29
-
30
-
31
-
32
-
33
-
34
-
35
-
36
-
37
-
38
-
39
-
40
-
 41
41 -
 42
42 -
 43
43 -
 44
44 -
 45
45 -
 46
46 -
 47
47 -
 48
48 -
 49
49 -
 50
50 -
 51
51 -
 52
52 -
 53
53 -
 54
54 -
 55
55 -
 56
56 -
 57
57 -
 58
58 -
 59
59 -
 60
60 -
 61
61 -
62
-
63
-
64
-
65
-
66
-
67
-
68
-
69
-
70
-
71
-
72
-
73
-
74
-
75
-
76
-
77
-
78
-
79
-
80
-
81
-
82
-
83
-
84
-
85
-
86
-
87
-
88
-
89
-
90
-
91
-
92
-
93
-
94
-
95
-
96
-
97
-
98
-
99
-
100
-
101
-
102
-
103
-
104
-
105
-
106
-
107
-
108
-
109
-
110
-
111
-
112
-
113
-
114
-
115
-
116
-
117
-
118
-
119
-
120
-
121
-
122
-
123
-
124
-
125
-
126
-
127
-
128
-
129
-
130
-
131
-
132
-
133
-
134
-
135
-
136
-
137
-
138
-
139
-
140
-
141
-
142
-
143
-
144
-
145
-
146
-
147
-
148
-
149
-
150
-
151
-
152
-
153
-
154
-
155
-
156
-
157
-
158
-
159
-
160
-
161
-
162
-
163
-
164
-
165
-
166
-
167
-
168
-
169
-
170
-
171
-
172
-
173
-
174
-
175
-
176
-
177
-
178
-
179
-
180
-
181
-
182
-
183
-
184
-
185
-
186
-
187
-
188
-
189
-
190
-
191
-
192
-
193
-
194
-
195
-
196
-
197
-
198
-
199
-
200
-
201
-
202
-
203
-
204
-
205
-
206
-
207
-
208
-
209
-
210
-
211
-
212
-
213
-
214
-
215
-
216
-
217
-
218
-
219
-
220
-
221
-
222
-
223
-
224
-
225
-
226
-
227
-
228
-
229
-
230
-
231
-
232
-
233
-
234
-
235
-
236
-
237
-
238
-
239
-
240
-
241
-
242
-
243
-
244
-
245
-
246
-
247
-
248
-
249
-
250
-
251
-
252
-
253
-
254
-
255
-
256
-
257
-
258
-
259
-
260
-
261
-
262
-
263
-
264
-
265
-
266
-
267
-
268
-
269
-
270
-
271
-
272
-
273
-
274
-
275
-
276
 |
 |

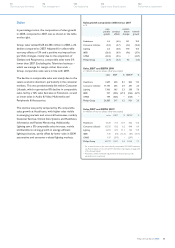
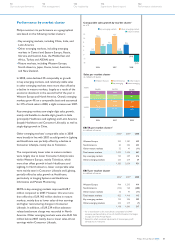
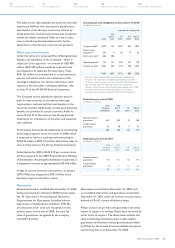
Comparable sales growth by market cluster
1)
as a %
2.7
12.6
6.3 7.6
13.7
2.8
7.2
(0.3)
(5.5)
2006 2007 2008
key emerging markets other emerging markets
mature markets
15
0
3
9
12
(6)
(3)
6
Sales per market cluster
in millions of euros
30,000
20,000
10,000
0
9,869
7,591
1,368
4,603
3,251
2006
26,682
10,275
7,147
1,331
4,435
3,605
2007
26,793
9,473
7,589
1,275
4,623
3,425
2008
26,385
Western Europe North America other mature
key emerging other emerging
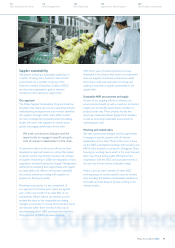
Performance by market cluster
Philips monitors its performance on a geographical
axis based on the following market clusters:
Key emerging markets, including China, India, and
•
Latin America
Other emerging markets, including emerging •
markets in Central and Eastern Europe, Russia,
Ukraine and Central Asia, the Middle East and
Africa, Turkey and ASEAN zone
Mature markets, including Western Europe, •
North America, Japan, Korea, Israel, Australia,
and New Zealand.
In 2008, sales declined 3% comparably as growth
in key emerging markets, and relatively stable sales
in other emerging markets were more than offset by
a decline in mature markets, largely as a result of the
economic downturn in the second half of the year in
Western Europe and North America. Overall, emerging
markets grew 4% on a comparable basis and accounted
for 31% of total sales in 2008, a slight increase over 2007.
Key emerging markets saw single-digit sales growth,
mainly attributable to double-digit growth in India
(principally Healthcare and Lighting) and Latin America
(largely Healthcare and Consumer Lifestyle), as well as
single-digit growth in China.
Other emerging markets’ comparable sales in 2008
were broadly in line with 2007, as solid growth in Lighting
and Healthcare was partially offset by a decline in
Consumer Lifestyle, mainly due to Television.
The comparatively lower sales in mature markets
were largely due to lower Consumer Lifestyle sales
within Western Europe, mainly Television, which
more than offset growth in both Healthcare and
Lighting. In North America, lower comparable sales
were mainly seen in Consumer Lifestyle and Lighting,
partially offset by sales growth at Healthcare,
particularly in Imaging Systems and Healthcare
Informatics and Patient Monitoring.
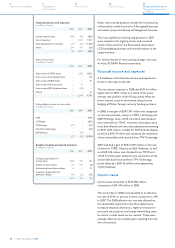
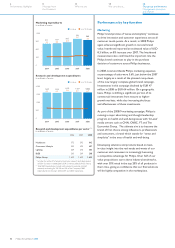
EBITA in key emerging markets improved EUR 7
million compared to 2007. However, this was more
than offset by a EUR 965 million decline in mature
markets, mainly due to lower sales-driven earnings
and higher restructuring charges in Consumer
Lifestyle. In addition, a EUR 239 million asbestos-
related settlement charge was recorded in North
America. Other emerging markets were also EUR 165
million below 2007, mainly due to lower sales-driven
earnings within Consumer Lifestyle.
EBITA per market cluster1)
in millions of euros
20062) 20072) 2008
Western Europe 953 1,281 439
North America 20 304 233
Other mature markets 32 41 (11)
Total mature markets 1,005 1,626 661
Key emerging markets 125 209 216
Other emerging markets 253 219 54
1,383 2,054 931
EBIT per market cluster
in millions of euros
20062) 20072) 2008
Western Europe 944 1,215 414
North America (154) 160 (288)
Other mature markets 32 41 (11)
Total mature markets 822 1,416 115
Key emerging markets 123 206 209
Other emerging markets 253 219 (7)
1,198 1,841 317
For a reconciliation to the most directly comparable US GAAP
1)
measures, see Reconciliation of non-US GAAP information that begins
on page 250 of this Annual Report
Revised to reflect immaterial adjustments of intercompany profit
2)
eliminations on inventories
Philips Annual Report 2008 51
122
Performance statements
114
Supervisory Board report
110
Our leadership
94
Risk management
70
Our sector performance