Philips 2008 Annual Report Download - page 223
Download and view the complete annual report
Please find page 223 of the 2008 Philips annual report below. You can navigate through the pages in the report by either clicking on the pages listed below, or by using the keyword search tool below to find specific information within the annual report.-
 1
1 -
2
-
3
-
4
-
5
-
6
-
7
-
8
-
9
-
10
-
11
-
12
-
13
-
14
-
15
-
16
-
17
-
18
-
19
-
20
-
21
-
22
-
23
-
24
-
25
-
26
-
27
-
28
-
29
-
30
-
31
-
32
-
33
-
34
-
35
-
36
-
37
-
38
-
39
-
40
-
41
-
42
-
43
-
44
-
45
-
46
-
47
-
48
-
49
-
50
-
51
-
52
-
53
-
54
-
55
-
56
-
57
-
58
-
59
-
60
-
61
-
62
-
63
-
64
-
65
-
66
-
67
-
68
-
69
-
70
-
71
-
72
-
73
-
74
-
75
-
76
-
77
-
78
-
79
-
80
-
81
-
82
-
83
-
84
-
85
-
86
-
87
-
88
-
89
-
90
-
91
-
92
-
93
-
94
-
95
-
96
-
97
-
98
-
99
-
100
-
101
-
102
-
103
-
104
-
105
-
106
-
107
-
108
-
109
-
110
-
111
-
112
-
113
-
114
-
115
-
116
-
117
-
118
-
119
-
120
-
121
-
122
-
123
-
124
-
125
-
126
-
127
-
128
-
129
-
130
-
131
-
132
-
133
-
134
-
135
-
136
-
137
-
138
-
139
-
140
-
141
-
142
-
143
-
144
-
145
-
146
-
147
-
148
-
149
-
150
-
151
-
152
-
153
-
154
-
155
-
156
-
157
-
158
-
159
-
160
-
161
-
162
-
163
-
164
-
165
-
166
-
167
-
168
-
169
-
170
-
171
-
172
-
173
-
174
-
175
-
176
-
177
-
178
-
179
-
180
-
181
-
182
-
183
-
184
-
185
-
186
-
187
-
188
-
189
-
190
-
191
-
192
-
193
-
194
-
195
-
196
-
197
-
198
-
199
-
200
-
201
-
202
-
203
-
204
-
205
-
206
-
207
-
208
-
209
-
210
-
211
-
212
-
 213
213 -
 214
214 -
 215
215 -
 216
216 -
 217
217 -
 218
218 -
 219
219 -
 220
220 -
 221
221 -
 222
222 -
 223
223 -
 224
224 -
 225
225 -
 226
226 -
 227
227 -
 228
228 -
 229
229 -
 230
230 -
 231
231 -
 232
232 -
 233
233 -
234
-
235
-
236
-
237
-
238
-
239
-
240
-
241
-
242
-
243
-
244
-
245
-
246
-
247
-
248
-
249
-
250
-
251
-
252
-
253
-
254
-
255
-
256
-
257
-
258
-
259
-
260
-
261
-
262
-
263
-
264
-
265
-
266
-
267
-
268
-
269
-
270
-
271
-
272
-
273
-
274
-
275
-
276
 |
 |

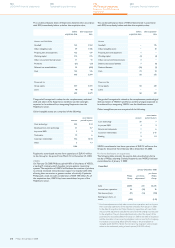
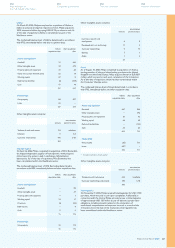
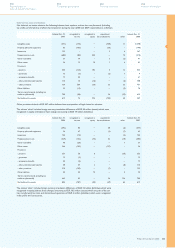
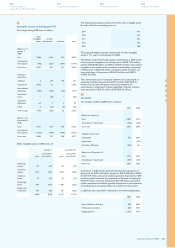
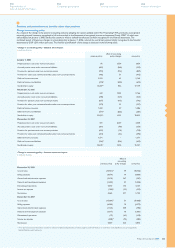
Depreciation and amortization
Depreciation of property, plant and equipment and amortization
of intangibles are as follows:
2006 2007 2008
Depreciation of property, plant and
equipment 554 562 729
Amortization of internal-use software 71 76 92
Amortization of other intangibles:
Amortization of other intangible -
assets
Amortization of development costs -
192
173
227
218
389
318
990 1,083 1,528
Depreciation of property, plant and equipment includes an additional
write-off in connection with the retirement of property, plant and
equipment amounting to EUR 40 million (2007: EUR 28 million, 2006:
EUR 20 million).
Included in depreciation of property, plant and equipment is an amount
of EUR 57 million (2007: EUR 22 million, 2006: EUR 17 million) relating
to impairment charges.
Depreciation of property, plant and equipment and amortization of
software and other intangible assets are primarily included in cost of
sales. Amortization of development cost is included in research and
development expenses.
Total depreciation and amortization
2006 2007 2008
Healthcare 257 333 486
Consumer Lifestyle 317 303 365
Lighting 255 332 540
Innovation & Emerging Businesses 82 44 68
Group Management & Services 79 71 69
990 1,083 1,528
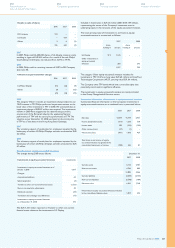
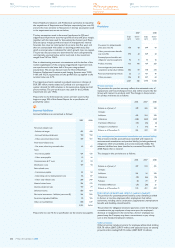
Impairment of goodwill
In 2008, EUR 301 million goodwill impairment charges were recorded
of which EUR 299 million was related to Lumileds (2007: EUR nil,
2006: EUR nil).
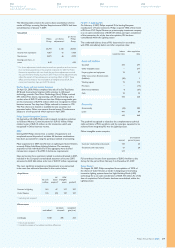
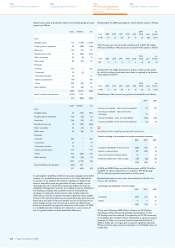
Other business income (expense)
Other business income (expense) consists of the following:
2006 2007 2008
Result on disposal of businesses:
- income 130 35 136
- expense (64) (65) (45)
Result on disposal of fixed assets:
- income 108 107 72
- expense (18) (24) (16)
Result on remaining businesses:
- income 90 127 53
- expense (67) (76) (25)
179 104 175
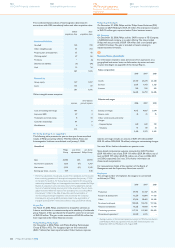
40
Results on the disposal of businesses consisted of:
2006 2007 2008
Automotive Playback Modules −(30) −
Philips Sound Solutions 12 −−
CryptoTec 26 −−
Connected Displays (Monitors) 23 −−
Set-Top Boxes and Connectivity
Solutions −−42
Philips Speech Recognition Systems −−45
Other 5 −4
66 (30) 91
The results on the disposal of businesses in 2008 are mainly related
to the sale of the Set-Top Boxes and Connectivity Solutions activities
to Pace Micro Technology which resulted in a gain of EUR 42 million,
and the sale of Speech Recognition activities to Nuance Communications
which resulted in a gain of EUR 45 million.The result on the disposal
of fixed assets is mainly related to the sale of fixed assets in Taiwan
with a gain of EUR 39 million.
The result on the disposal of businesses in 2007 mainly related to
the sale of Automotive Playback Modules which resulted in a loss of
EUR 30 million. The result on the sale of fixed assets mainly related
to the sale of certain buildings in Austria and the Netherlands as well
as land in the US. The other business results are mainly attributable
to certain settlements and the finalization of several divestitures.
The result on the disposal of businesses in 2006 is related mainly to
the sale of the CryptoTec activities which delivered a gain of EUR 26
million, the sale of Philips Sound Solutions PSS to D&M Holding at a
gain of EUR 12 million and the sale of Television at a gain of EUR 23
million. The result on the disposal of fixed assets is mainly related to
the sale of certain real estate assets in Austria with a gain of EUR 31
million. Other business income consists of the settlement of certain
legal claims and some releases of provisions.
41
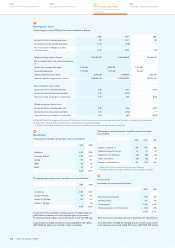
Financial income and expenses
2006 2007 2008
Interest income 150 236 141
Interest expense (339) (279) (246)
Net interest expense (189) (43) (105)
Sale of securities - 2,804 1,406
Impairment of securities (77) (36) (1,148)
Foreign exchange results 2 (1) (13)
Other financial income (expenses), net 293 125 (52)
218 2,892 193
29 2,849 88
Interest income decreased by EUR 95 million during 2008, mainly as a
result of lower average cash balances during 2008, compared to 2007.
Interest expense decreased by EUR 33 million during 2008, mainly as
a result of lower interest costs on derivatives related to hedging of
Philips foreign currency funding positions.
In 2008, income from the sale of securities totaled EUR 1,406 million.
This included EUR 1,205 million gain from the sale of shares in TSMC,
EUR 158 million gain on the sale of shares in LG Display, and EUR 20
million gain on the sale of shares in D&M. These gains were offset by
impairment charges amounting to EUR 1,148 million. This included
EUR 599 million for NXP, EUR 448 million for LG Display, EUR 71
million for TPO and EUR 30 million for Pace Micro Technology.
Furthermore, other financial expense primarily consisted of a EUR 37
million loss related to the revaluation of the convertible bond received
from TPV Technology and a EUR 23 million dividend from TSMC.
41
Philips Annual Report 2008 223
254
Corporate governance
250
Reconciliation of
non-US GAAP information
262
Ten-year overview
266
Investor information