Philips 2008 Annual Report Download - page 130
Download and view the complete annual report
Please find page 130 of the 2008 Philips annual report below. You can navigate through the pages in the report by either clicking on the pages listed below, or by using the keyword search tool below to find specific information within the annual report.-
 1
1 -
2
-
3
-
4
-
5
-
6
-
7
-
8
-
9
-
10
-
11
-
12
-
13
-
14
-
15
-
16
-
17
-
18
-
19
-
20
-
21
-
22
-
23
-
24
-
25
-
26
-
27
-
28
-
29
-
30
-
31
-
32
-
33
-
34
-
35
-
36
-
37
-
38
-
39
-
40
-
41
-
42
-
43
-
44
-
45
-
46
-
47
-
48
-
49
-
50
-
51
-
52
-
53
-
54
-
55
-
56
-
57
-
58
-
59
-
60
-
61
-
62
-
63
-
64
-
65
-
66
-
67
-
68
-
69
-
70
-
71
-
72
-
73
-
74
-
75
-
76
-
77
-
78
-
79
-
80
-
81
-
82
-
83
-
84
-
85
-
86
-
87
-
88
-
89
-
90
-
91
-
92
-
93
-
94
-
95
-
96
-
97
-
98
-
99
-
100
-
101
-
102
-
103
-
104
-
105
-
106
-
107
-
108
-
109
-
110
-
111
-
112
-
113
-
114
-
115
-
116
-
117
-
118
-
119
-
 120
120 -
 121
121 -
 122
122 -
 123
123 -
 124
124 -
 125
125 -
 126
126 -
 127
127 -
 128
128 -
 129
129 -
 130
130 -
 131
131 -
 132
132 -
 133
133 -
 134
134 -
 135
135 -
 136
136 -
 137
137 -
 138
138 -
 139
139 -
 140
140 -
141
-
142
-
143
-
144
-
145
-
146
-
147
-
148
-
149
-
150
-
151
-
152
-
153
-
154
-
155
-
156
-
157
-
158
-
159
-
160
-
161
-
162
-
163
-
164
-
165
-
166
-
167
-
168
-
169
-
170
-
171
-
172
-
173
-
174
-
175
-
176
-
177
-
178
-
179
-
180
-
181
-
182
-
183
-
184
-
185
-
186
-
187
-
188
-
189
-
190
-
191
-
192
-
193
-
194
-
195
-
196
-
197
-
198
-
199
-
200
-
201
-
202
-
203
-
204
-
205
-
206
-
207
-
208
-
209
-
210
-
211
-
212
-
213
-
214
-
215
-
216
-
217
-
218
-
219
-
220
-
221
-
222
-
223
-
224
-
225
-
226
-
227
-
228
-
229
-
230
-
231
-
232
-
233
-
234
-
235
-
236
-
237
-
238
-
239
-
240
-
241
-
242
-
243
-
244
-
245
-
246
-
247
-
248
-
249
-
250
-
251
-
252
-
253
-
254
-
255
-
256
-
257
-
258
-
259
-
260
-
261
-
262
-
263
-
264
-
265
-
266
-
267
-
268
-
269
-
270
-
271
-
272
-
273
-
274
-
275
-
276
 |
 |

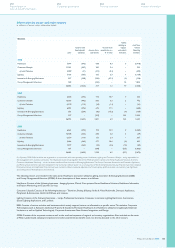
Consolidated statements of cash flows of the Philips Group for the years ended December 31
in millions of euros
2006 2007 2008
Cash flows from operating activities
Net income (loss) 5,381 4,160 (186)
(Income) loss from discontinued operations (4,482) 433 8
Adjustments to reconcile net income (loss) to net cash provided by operating activities:
Depreciation and amortization 810 851 1,190
Impairment of goodwill, equity-accounted investees and available-for-sale securities 8 39 1,590
Net gain on sale of assets (289) (3,159) (1,369)
Loss (income) from equity-accounted investees 228 (249) (91)
Dividends received from equity-accounted investees −48 65
Minority interests (net of dividends paid) 3 5 3
(Increase) decrease in receivables and other current assets (1,354) (439) 276
Decrease (increase) in inventories 5 (378) 41
(Decrease) increase in accounts payable, accrued and other liabilities (20) 186 (165)
(Increase) in non-current receivables/other assets (55) (143) (331)
Increase (decrease) in provisions 82 (68) 406
Proceeds from sales of trading securities −196 −
Other items 13 37 58
Net cash provided by operating activities 330 1,519 1,495
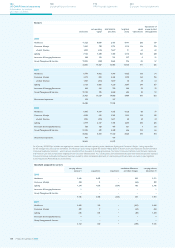
Cash flows from investing activities
Purchase of intangible assets (101) (118) (121)
Capital expenditures on property, plant and equipment (694) (661) (771)
Proceeds from disposals of property, plant and equipment 107 81 170
Cash from derivatives 62 385 337
Purchase of other non-current financial assets (31) (17) −
Proceeds from other non-current financial assets 4 4,105 2,576
Purchase of businesses, net of cash acquired (2,467) (1,485) (5,316)
Proceeds from sale of interests in businesses 318 1,640 24
Net cash (used for) provided by investing activities (2,802) 3,930 (3,101)
Cash flows from financing activities
Increase (decrease) in short-term debt 97 (158) 18
Principal payments on short-term portion of long-term debt (543) (152) (1,726)
Proceeds from issuance of long-term debt 9 29 2,088
Treasury stock transactions (2,755) (1,448) (3,257)
Dividends paid (523) (639) (698)
Net cash used for financing activities (3,715) (2,368) (3,575)
Net cash (used for) provided by continuing operations (6,187) 3,081 (5,181)
Cash flows from discontinued operations
Net cash provided by (used for) operating activities 524 (153) (49)
Net cash provided by investing activities 6,590 38 12
Net cash provided by (used for) financing activities −−−
Net cash provided by (used for) discontinued operations 7,114 (115) (37)
Net cash provided by (used for) continuing and discontinued operations 927 2,966 (5,218)
Effect of changes in exchange rates on cash and cash equivalents (197) (112) (39)
Cash and cash equivalents at the beginning of the year 5,293 6,023 8,877
Cash and cash equivalents at the end of the year 6,023 8,877 3,620
Less cash and cash equivalents at the end of the year - discontinued operations 137 108 −
Cash and cash equivalents at the end of the year - continuing operations 5,886 8,769 3,620
Prior-period amounts have been revised to reflect immaterial adjustments of intercompany profit elimination on inventory (see Significant accounting policies, Reclassifications
and revisions). The accompanying notes are an integral part of these consolidated financial statements. For a number of reasons, principally the effects of translation
differences and consolidation changes, certain items in the statements of cash flows do not correspond to the differences in the respective balance sheet amounts.
29
30
Philips Annual Report 2008130
180
Sustainability performance
192
IFRS financial statements
244
Company financial statements
124
US GAAP financial statements
Consolidated statements of cash flows