Philips 2008 Annual Report Download - page 236
Download and view the complete annual report
Please find page 236 of the 2008 Philips annual report below. You can navigate through the pages in the report by either clicking on the pages listed below, or by using the keyword search tool below to find specific information within the annual report.-
 1
1 -
2
-
3
-
4
-
5
-
6
-
7
-
8
-
9
-
10
-
11
-
12
-
13
-
14
-
15
-
16
-
17
-
18
-
19
-
20
-
21
-
22
-
23
-
24
-
25
-
26
-
27
-
28
-
29
-
30
-
31
-
32
-
33
-
34
-
35
-
36
-
37
-
38
-
39
-
40
-
41
-
42
-
43
-
44
-
45
-
46
-
47
-
48
-
49
-
50
-
51
-
52
-
53
-
54
-
55
-
56
-
57
-
58
-
59
-
60
-
61
-
62
-
63
-
64
-
65
-
66
-
67
-
68
-
69
-
70
-
71
-
72
-
73
-
74
-
75
-
76
-
77
-
78
-
79
-
80
-
81
-
82
-
83
-
84
-
85
-
86
-
87
-
88
-
89
-
90
-
91
-
92
-
93
-
94
-
95
-
96
-
97
-
98
-
99
-
100
-
101
-
102
-
103
-
104
-
105
-
106
-
107
-
108
-
109
-
110
-
111
-
112
-
113
-
114
-
115
-
116
-
117
-
118
-
119
-
120
-
121
-
122
-
123
-
124
-
125
-
126
-
127
-
128
-
129
-
130
-
131
-
132
-
133
-
134
-
135
-
136
-
137
-
138
-
139
-
140
-
141
-
142
-
143
-
144
-
145
-
146
-
147
-
148
-
149
-
150
-
151
-
152
-
153
-
154
-
155
-
156
-
157
-
158
-
159
-
160
-
161
-
162
-
163
-
164
-
165
-
166
-
167
-
168
-
169
-
170
-
171
-
172
-
173
-
174
-
175
-
176
-
177
-
178
-
179
-
180
-
181
-
182
-
183
-
184
-
185
-
186
-
187
-
188
-
189
-
190
-
191
-
192
-
193
-
194
-
195
-
196
-
197
-
198
-
199
-
200
-
201
-
202
-
203
-
204
-
205
-
206
-
207
-
208
-
209
-
210
-
211
-
212
-
213
-
214
-
215
-
216
-
217
-
218
-
219
-
220
-
221
-
222
-
223
-
224
-
225
-
 226
226 -
 227
227 -
 228
228 -
 229
229 -
 230
230 -
 231
231 -
 232
232 -
 233
233 -
 234
234 -
 235
235 -
 236
236 -
 237
237 -
 238
238 -
 239
239 -
 240
240 -
 241
241 -
 242
242 -
 243
243 -
 244
244 -
 245
245 -
 246
246 -
247
-
248
-
249
-
250
-
251
-
252
-
253
-
254
-
255
-
256
-
257
-
258
-
259
-
260
-
261
-
262
-
263
-
264
-
265
-
266
-
267
-
268
-
269
-
270
-
271
-
272
-
273
-
274
-
275
-
276
 |
 |

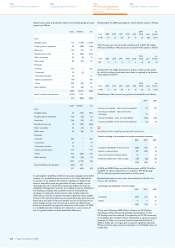
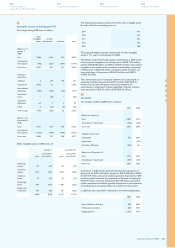
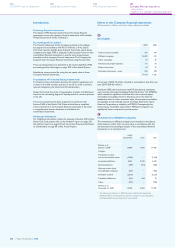
The weighted averages of the assumptions used to calculate the net
periodic pension cost for years ended December 31:
2007 2008
Nether-
lands other
Nether-
lands other
Discount rate 4.3% 5.2% 4.8% 5.6%
Expected returns
on plan assets 5.7% 6.1% 5.7% 6.4%
Rate of
compensation
increase * 3.5% * 3.9%
* The rate of compensation increase for the Netherlands consists of a general
compensation increase and an individual salary increase based on merit, seniority
and promotion. The average individual salary increase for all active participants
for the remaining working lifetime is 0.75% annually. The assumed rate of
general compensation increase for the Netherlands for calculating the projected
benefit obligations, amounts to 2.0% (2007: 2.3%). The indexation assumption
used to calculate the projected benefit obligations for the Netherlands is 1.0%
(2007: 1.15%).
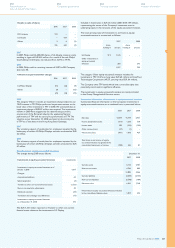
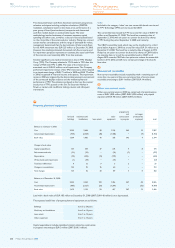
Historical data
2006 2007 2008
Present value of defined-benefit obligations 20,410 18,679 16,846
Fair value of plan assets 21,352 20,200 17,899
Surplus 942 1,521 1,053
Experience adjustments in % on:
- defined-benefit obligations (gain) loss (0.9%) (0.8%) 1.2%
- fair value of plan assets (gain) loss 0.8% 2.8% 10.9%
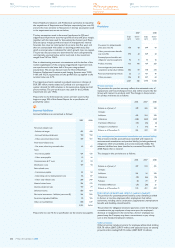
Defined-benefit plans: other postretirement benefits
In addition to providing pension benefits, the Company provides other
postretirement benefits, primarily retiree healthcare benefits, in
certain countries. The Company funds those other postretirement
benefit plans as claims are incurred.
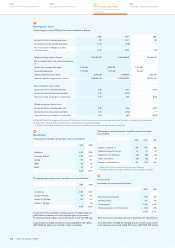
Movements in the net liability for other defined-benefit obligations:
2007 2008
Accumulated benefit obligation at the
beginning of year 373 413
Service cost 3 3
Interest cost 26 34
Actuarial gains 47 (49)
Plan amendments (5) −
Settlements (6) −
Changes in consolidation 27 −
Benefits paid (32) (24)
Exchange rate differences (19) (36)
Miscellaneous (1) 12
Accumulated benefit obligation at end of year 413 353
Present value of funded obligations at end of year −−
Present value of unfunded obligations at end of
year 413 353
2007 2008
Funded status (413) (353)
Unrecognized prior-service cost (6) 1
Net balances (419) (352)
Classification of the net balance is as follows:
Provision for other postretirement benefits - (419) (352)
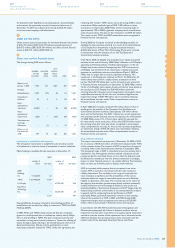
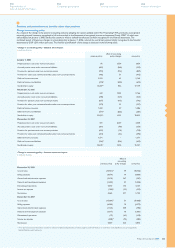
Cumulative amount of actuarial (gains) and losses recognized in
the statement of recognized income and expense (pre tax):
2007 2008
Balance as of January 1 2 59
New consolidations 7 −
Net actuarial loss (gain) 50 (60)
Balance as of December 31 59 (1)
Other postretirement benefit expense recognized in the income
statement:
2006 2007 2008
Service cost 4 3 3
Interest cost on accumulated
postretirement benefits 26 26 34
Prior-service cost −−(6)
30 29 31
of which discontinued operations −−−
Amounts recognized in the Statement of recognized income and
expenses (Sorie):
2006 2007 2008
Actuarial (gains) and losses (12) 50 (60)
Total recognized in Sorie (12) 50 (60)
Total recognized in net periodic
pension cost and Sorie 18 79 (29)
The expense for other postretirement benefits is recognized in
the following line items in the income statement:
2006 2007 2008
Cost of sales 3 2 4
Selling expenses 3 2 3
General and administrative expenses 24 24 24
Research and development expenses −1−
30 29 31
The weighted average assumptions used to calculate the postretirement
benefit obligations other than pensions as of December 31 were as
follows:
2007 2008
Discount rate 8.5% 9.7%
Compensation increase (where applicable) −−
Philips Annual Report 2008236
180
Sustainability performance
244
Company financial statements
124
US GAAP financial statements
192
IFRS financial statements
Notes to the IFRS financial
statements