Philips 2008 Annual Report Download - page 132
Download and view the complete annual report
Please find page 132 of the 2008 Philips annual report below. You can navigate through the pages in the report by either clicking on the pages listed below, or by using the keyword search tool below to find specific information within the annual report.-
 1
1 -
2
-
3
-
4
-
5
-
6
-
7
-
8
-
9
-
10
-
11
-
12
-
13
-
14
-
15
-
16
-
17
-
18
-
19
-
20
-
21
-
22
-
23
-
24
-
25
-
26
-
27
-
28
-
29
-
30
-
31
-
32
-
33
-
34
-
35
-
36
-
37
-
38
-
39
-
40
-
41
-
42
-
43
-
44
-
45
-
46
-
47
-
48
-
49
-
50
-
51
-
52
-
53
-
54
-
55
-
56
-
57
-
58
-
59
-
60
-
61
-
62
-
63
-
64
-
65
-
66
-
67
-
68
-
69
-
70
-
71
-
72
-
73
-
74
-
75
-
76
-
77
-
78
-
79
-
80
-
81
-
82
-
83
-
84
-
85
-
86
-
87
-
88
-
89
-
90
-
91
-
92
-
93
-
94
-
95
-
96
-
97
-
98
-
99
-
100
-
101
-
102
-
103
-
104
-
105
-
106
-
107
-
108
-
109
-
110
-
111
-
112
-
113
-
114
-
115
-
116
-
117
-
118
-
119
-
120
-
121
-
 122
122 -
 123
123 -
 124
124 -
 125
125 -
 126
126 -
 127
127 -
 128
128 -
 129
129 -
 130
130 -
 131
131 -
 132
132 -
 133
133 -
 134
134 -
 135
135 -
 136
136 -
 137
137 -
 138
138 -
 139
139 -
 140
140 -
 141
141 -
 142
142 -
143
-
144
-
145
-
146
-
147
-
148
-
149
-
150
-
151
-
152
-
153
-
154
-
155
-
156
-
157
-
158
-
159
-
160
-
161
-
162
-
163
-
164
-
165
-
166
-
167
-
168
-
169
-
170
-
171
-
172
-
173
-
174
-
175
-
176
-
177
-
178
-
179
-
180
-
181
-
182
-
183
-
184
-
185
-
186
-
187
-
188
-
189
-
190
-
191
-
192
-
193
-
194
-
195
-
196
-
197
-
198
-
199
-
200
-
201
-
202
-
203
-
204
-
205
-
206
-
207
-
208
-
209
-
210
-
211
-
212
-
213
-
214
-
215
-
216
-
217
-
218
-
219
-
220
-
221
-
222
-
223
-
224
-
225
-
226
-
227
-
228
-
229
-
230
-
231
-
232
-
233
-
234
-
235
-
236
-
237
-
238
-
239
-
240
-
241
-
242
-
243
-
244
-
245
-
246
-
247
-
248
-
249
-
250
-
251
-
252
-
253
-
254
-
255
-
256
-
257
-
258
-
259
-
260
-
261
-
262
-
263
-
264
-
265
-
266
-
267
-
268
-
269
-
270
-
271
-
272
-
273
-
274
-
275
-
276
 |
 |

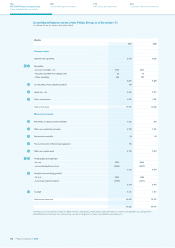
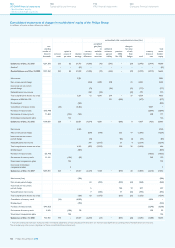
Consolidated statements of changes in stockholders’ equity of the Philips Group
in millions of euros unless otherwise stated
accumulated other comprehensive income (loss)
out-
standing
number of
shares in
thousands
common
stock
capital in
excess of
par value
retained
earnings
currency
translation
differences
unrealized
gain (loss)
on
available-
for-sale
securities
additional
minimum
pension
liability
pensions
(SFAS
No. 158)
change in
fair value
of cash
flow
hedges total
treasury
shares at
cost
total
stock-
holders’
equity
Balance as of Dec. 31, 2005 1,201,358 263 82 21,710 (1,886) (10) (545) −(29) (2,470) (2,919) 16,666
Revision1) −−−(32) −−−−−−−(32)
Revised balance as of Dec. 31, 2005
1,201,358 263 82 21,678 (1,886) (10) (545) −(29) (2,470) (2,919) 16,634
Net income 5,381 5,381
Net current period change (304) 4,389 298 72 4,455 4,455
Income tax on net current
period change (72) (84) (15) (171) (171)
Reclassifications into income 388 (98) (20) 270 270
Total comprehensive income net of tax
5,381 12 4,291 214 −37 4,554 9,935
Adoption of SFAS No. 158 331 (808) (477) (477)
Dividend paid (523) (523)
Cancellation of treasury shares (35) (4,332) 4,367 −
Purchase of treasury stock (105,949) (2,899) (2,899)
Re-issuance of treasury stock 11,484 (204) (153) 528 171
Share-based compensation plans 122 122
Balance as of Dec. 31, 2006 1,106,893 228 −22,051 (1,874) 4,281 −(808) 8 1,607 (923) 22,963
Net income 4,160 4,160
Net current period change (830) (618) 223 19 (1,206) (1,206)
Income tax on net current
period change (10) (56) (3) (69) (69)
Reclassifications into income 341 (2,615) 51 4 (2,219) (2,219)
Total comprehensive income net of tax
4,160 (499) (3,233) 218 20 (3,494) 666
Dividend paid (659) (659)
Purchase of treasury stock (53,141) (1,633) (1,633)
Re-issuance of treasury stock 11,141 (106) (35) 340 199
Share-based compensation plans 104 104
Income tax share-based
compensation plans 2 2
Balance as of Dec. 31, 2007 1,064,893 228 −25,517 (2,373) 1,048 −(590) 28 (1,887) (2,216) 21,642
Net income (loss) (186) (186)
Net current period change 69 (493) (520) (24) (968) (968)
Income tax on net current
period change 5 184 18 207 207
Reclassifications into income 9 (582) 31 (50) (592) (592)
Total comprehensive income net of tax
(186) 83 (1,075) (305) (56) (1,353) (1,539)
Cancellation of treasury stock (34) (4,062) 4,096 −
Dividend paid (720) (720)
Purchase of treasury stock (146,453) (3,298) (3,298)
Re-issuance of treasury stock 4,542 (106) 28 130 52
Share-based compensation plans 106 106
Balance as of Dec. 31, 2008 922,982 194 – 20,577 (2,290) (27) −(895) (28) (3,240) (1,288) 16,243
Prior-period amounts have been revised to reflect immaterial adjustments of intercompany profit elimination on inventory (see Significant accounting policies, Reclassifications and revisions).
1)
The accompanying notes are an integral part of these consolidated financial statements.
Philips Annual Report 2008132
180
Sustainability performance
192
IFRS financial statements
244
Company financial statements
124
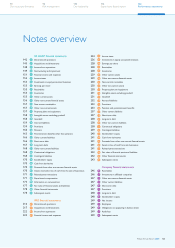
US GAAP financial statements
- Stockholders’ equity
- Sectors and main countries