Philips 2008 Annual Report Download - page 152
Download and view the complete annual report
Please find page 152 of the 2008 Philips annual report below. You can navigate through the pages in the report by either clicking on the pages listed below, or by using the keyword search tool below to find specific information within the annual report.-
 1
1 -
2
-
3
-
4
-
5
-
6
-
7
-
8
-
9
-
10
-
11
-
12
-
13
-
14
-
15
-
16
-
17
-
18
-
19
-
20
-
21
-
22
-
23
-
24
-
25
-
26
-
27
-
28
-
29
-
30
-
31
-
32
-
33
-
34
-
35
-
36
-
37
-
38
-
39
-
40
-
41
-
42
-
43
-
44
-
45
-
46
-
47
-
48
-
49
-
50
-
51
-
52
-
53
-
54
-
55
-
56
-
57
-
58
-
59
-
60
-
61
-
62
-
63
-
64
-
65
-
66
-
67
-
68
-
69
-
70
-
71
-
72
-
73
-
74
-
75
-
76
-
77
-
78
-
79
-
80
-
81
-
82
-
83
-
84
-
85
-
86
-
87
-
88
-
89
-
90
-
91
-
92
-
93
-
94
-
95
-
96
-
97
-
98
-
99
-
100
-
101
-
102
-
103
-
104
-
105
-
106
-
107
-
108
-
109
-
110
-
111
-
112
-
113
-
114
-
115
-
116
-
117
-
118
-
119
-
120
-
121
-
122
-
123
-
124
-
125
-
126
-
127
-
128
-
129
-
130
-
131
-
132
-
133
-
134
-
135
-
136
-
137
-
138
-
139
-
140
-
141
-
 142
142 -
 143
143 -
 144
144 -
 145
145 -
 146
146 -
 147
147 -
 148
148 -
 149
149 -
 150
150 -
 151
151 -
 152
152 -
 153
153 -
 154
154 -
 155
155 -
 156
156 -
 157
157 -
 158
158 -
 159
159 -
 160
160 -
 161
161 -
 162
162 -
163
-
164
-
165
-
166
-
167
-
168
-
169
-
170
-
171
-
172
-
173
-
174
-
175
-
176
-
177
-
178
-
179
-
180
-
181
-
182
-
183
-
184
-
185
-
186
-
187
-
188
-
189
-
190
-
191
-
192
-
193
-
194
-
195
-
196
-
197
-
198
-
199
-
200
-
201
-
202
-
203
-
204
-
205
-
206
-
207
-
208
-
209
-
210
-
211
-
212
-
213
-
214
-
215
-
216
-
217
-
218
-
219
-
220
-
221
-
222
-
223
-
224
-
225
-
226
-
227
-
228
-
229
-
230
-
231
-
232
-
233
-
234
-
235
-
236
-
237
-
238
-
239
-
240
-
241
-
242
-
243
-
244
-
245
-
246
-
247
-
248
-
249
-
250
-
251
-
252
-
253
-
254
-
255
-
256
-
257
-
258
-
259
-
260
-
261
-
262
-
263
-
264
-
265
-
266
-
267
-
268
-
269
-
270
-
271
-
272
-
273
-
274
-
275
-
276
 |
 |

6
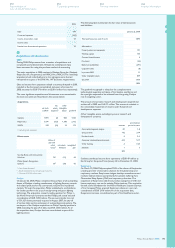
Income taxes
The tax expense on income before tax amounted to EUR 286 million
(2007: EUR 619 million, 2006: EUR 166 million).
The components of income before taxes and income tax expense
are as follows:
2006 2007 2008
Netherlands 444 2,770 142
Foreign 782 1,684 (50)
Income before taxes 1,226 4,454 92
Netherlands:
Current taxes 81 (41) 20
Deferred taxes (58) (144) (153)
23 (185) (133)
Foreign:
Current taxes (273) (360) (289)
Deferred taxes 84 (74) 136
(189) (434) (153)
Income tax expense (166) (619) (286)
Philips’ operations are subject to income taxes in various foreign
jurisdictions. The statutory income tax rates vary from 10.0% to
40.7%, which causes a difference between the weighted average
statutory income tax rate and the Netherlands’ statutory income tax
rate of 25.5% (2007: 25.5%; 2006: 29.6%).
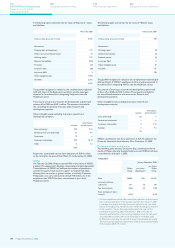
A reconciliation of the weighted average statutory income tax rate
to the effective income tax rate is as follows:
in % 2006 2007 2008
Weighted average statutory income tax rate 30.1 26.9 (22.3)
Tax rate effect of:
Changes in the valuation allowance:
- utilization of previously reserved loss
carryforwards (1.6) (0.2) (22.5)
- new loss carryforwards not expected
to be realized 2.2 0.9 107.5
- additions (releases) 3.4 (3.5) 2.3
Non-tax-deductible impairment charges −0.2 449.6
Non-taxable income (16.0) (17.3) (428.0)
Non-tax-deductible expenses 8.9 1.2 142.5
Withholding and other taxes 1.3 (0.2) (7.8)
Tax rate changes (6.5) 2.6 1.6
Uncertain tax positions −1.8 57.7
Tax incentives and other (8.3) 1.5 30.2
Effective income tax rate 13.5 13.9 310.8
The weighted average statutory income tax rate decreased in 2008
compared to 2007 due to a significant change in the country mix of
income tax rates, due to losses in countries with higher income tax
rates and profits in countries with relatively lower income tax rates,
combined with a lower income before tax.
The effective income tax rate is higher than the weighted average
statutory income tax rate in 2008, mainly due to new losses carried
forward not expected to be realized, non-tax deductible impairment
charges, and income tax expenses due to tax provisions for uncertain
tax positions, which were partly offset by non-taxable gains on the
sale of securities and other non-taxable income.
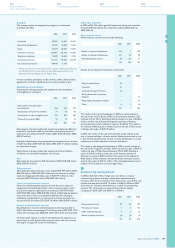
Deferred tax assets and liabilities
Deferred tax assets and liabilities relate to the following balance
sheet captions:
2007 2008
assets liabilities assets liabilities
Intangible assets 110 (298) 174 (1,328)
Property, plant and equipment 126 (55) 62 (206)
Inventories 164 (32) 163 (13)
Prepaid pension costs 18 (784) 58 (763)
Other receivables 52 (9) 50 (9)
Other assets 58 (34) 82 (20)
Provisions:
- pensions 444 (9) 435 −
- guarantees 13 −10 −
- termination benefits 19 −61 −
- other postretirement benefits 147 −129 −
- other provisions 368 (277) 825 (65)
Other liabilities 192 (35) 235 (75)
Total deferred
tax assets/liabilities 1,711 (1,533) 2,284 (2,479)
Tax loss carryforwards (including
tax credit carryforwards) 1,014 988
Net deferred tax position 1,192 793
Valuation allowances (494) (568)
Net deferred tax assets 698 225
Other provisions include provisions for restructuring and a EUR 251
million deferred tax asset position of legal claims for asbestos.
In assessing the realizability of deferred tax assets, management
considers whether it is more likely than not that some portion or all
of the deferred tax assets will not be realized. The ultimate realization
of deferred tax assets is dependent upon the generation of future
taxable income during the periods in which those temporary differences
become deductible. Management considers the scheduled reversal of
deferred tax liabilities, projected future taxable income and tax planning
strategies in making this assessment. In order to fully realize the
deferred tax assets arising from net operating losses, the Company
will need to generate future taxable income in the countries where
the net operating losses were incurred. Based upon the level of
historical taxable income and projections for future taxable income
over the periods in which the deferred tax assets are deductible,
management believes, as at December 31, 2008, it is more likely than
not that the Company will realize the benefits of these deductible
differences, net of the existing valuation allowance.
The valuation allowance for deferred tax assets was EUR 568 million
and EUR 494 million as of December 31, 2008 and 2007, respectively.
The net changes in the total valuation allowance, due to re-assessment
by management, were an increase of EUR 74 million, a decrease of
EUR 227 million and a decrease of EUR 214 million for the years
ended December 31, 2008, 2007 and 2006, respectively.
Philips Annual Report 2008152
180
Sustainability performance
192
IFRS financial statements
244
Company financial statements
124
US GAAP financial statements
Notes to the US GAAP
financial statements