Philips 2008 Annual Report Download - page 156
Download and view the complete annual report
Please find page 156 of the 2008 Philips annual report below. You can navigate through the pages in the report by either clicking on the pages listed below, or by using the keyword search tool below to find specific information within the annual report.-
 1
1 -
2
-
3
-
4
-
5
-
6
-
7
-
8
-
9
-
10
-
11
-
12
-
13
-
14
-
15
-
16
-
17
-
18
-
19
-
20
-
21
-
22
-
23
-
24
-
25
-
26
-
27
-
28
-
29
-
30
-
31
-
32
-
33
-
34
-
35
-
36
-
37
-
38
-
39
-
40
-
41
-
42
-
43
-
44
-
45
-
46
-
47
-
48
-
49
-
50
-
51
-
52
-
53
-
54
-
55
-
56
-
57
-
58
-
59
-
60
-
61
-
62
-
63
-
64
-
65
-
66
-
67
-
68
-
69
-
70
-
71
-
72
-
73
-
74
-
75
-
76
-
77
-
78
-
79
-
80
-
81
-
82
-
83
-
84
-
85
-
86
-
87
-
88
-
89
-
90
-
91
-
92
-
93
-
94
-
95
-
96
-
97
-
98
-
99
-
100
-
101
-
102
-
103
-
104
-
105
-
106
-
107
-
108
-
109
-
110
-
111
-
112
-
113
-
114
-
115
-
116
-
117
-
118
-
119
-
120
-
121
-
122
-
123
-
124
-
125
-
126
-
127
-
128
-
129
-
130
-
131
-
132
-
133
-
134
-
135
-
136
-
137
-
138
-
139
-
140
-
141
-
142
-
143
-
144
-
145
-
 146
146 -
 147
147 -
 148
148 -
 149
149 -
 150
150 -
 151
151 -
 152
152 -
 153
153 -
 154
154 -
 155
155 -
 156
156 -
 157
157 -
 158
158 -
 159
159 -
 160
160 -
 161
161 -
 162
162 -
 163
163 -
 164
164 -
 165
165 -
 166
166 -
167
-
168
-
169
-
170
-
171
-
172
-
173
-
174
-
175
-
176
-
177
-
178
-
179
-
180
-
181
-
182
-
183
-
184
-
185
-
186
-
187
-
188
-
189
-
190
-
191
-
192
-
193
-
194
-
195
-
196
-
197
-
198
-
199
-
200
-
201
-
202
-
203
-
204
-
205
-
206
-
207
-
208
-
209
-
210
-
211
-
212
-
213
-
214
-
215
-
216
-
217
-
218
-
219
-
220
-
221
-
222
-
223
-
224
-
225
-
226
-
227
-
228
-
229
-
230
-
231
-
232
-
233
-
234
-
235
-
236
-
237
-
238
-
239
-
240
-
241
-
242
-
243
-
244
-
245
-
246
-
247
-
248
-
249
-
250
-
251
-
252
-
253
-
254
-
255
-
256
-
257
-
258
-
259
-
260
-
261
-
262
-
263
-
264
-
265
-
266
-
267
-
268
-
269
-
270
-
271
-
272
-
273
-
274
-
275
-
276
 |
 |

12
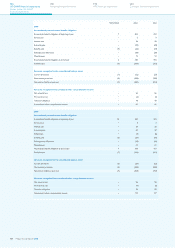
Other non-current financial assets
The changes during 2008 are as follows:
available-
for-sale
securities
restricted
liquid
assets
cost-
method
invest-
ments other total
Balance as of
January 1, 2008 1,776 101 1,027 279 3,183
Changes:
Reclassifications 1,601 (27) (3) 24 1,595
Acquisitions/
additions 75 2 2 82 161
Sales/
redemptions/
reductions (2,530) −(2) (22) (2,554)
Value
adjustments/
impairments (323) −(673) (69) (1,065)
Translation
and exchange
differences −(1) −12 11
Balance as of
December 31,
2008 599 75 351 306 1,331
Investments in available-for-sale securities
The Company’s investments in available-for-sale securities consist
of investments in shares of companies in various industries.
Major holdings in available-for-sale securities at December 31:
2007 2008
number of
shares fair value
number of
shares fair value
D&M Holdings 11,126,640 32 −−
TSMC 1,311,490,224 1,699 −−
LG Display −−47,225,000 558
Pace Micro
Technology −−50,701,049 29
1,731 587
During 2008, the Company reduced its shareholding portfolio of
available-for-sale securities by selling its interests in TSMC and D&M
Holdings (D&M).
In 2007, Philips and TSMC jointly announced that the companies
agreed to a multi-phased plan to facilitate an orderly exit by Philips
from its shareholding in TSMC. The plan comprised a private sale
transaction to long-term financial investors in Taiwan, the offering of
shares through a public offering in the United States (in the form of
American Depositary Shares) and the participation in stock repurchase
programs initiated by TSMC. Under this agreement, the remaining
1,311 million TSMC shares were sold during 2008 in various transactions.
Philips realized a gain of EUR 1,082 million on these transactions.
In September 2008, Philips sold its remaining stake of approximately
13% in D&M, a Japanese company which manufactures audio-visual
products. The company realized a gain on this transaction of EUR 16
million. The results on the TSMC and D&M transactions were
recognized in Financial income and expenses.
During 2008, the Company increased its shareholding portfolio of
available-for-sale securities primarily as a result of the reclassification
of LG Display from equity-accounted investees. Additionally, shares of
Pace Micro Technology were received in conjunction with the
divesture of our Set-Top Boxes and Connectivity Solutions activities.
Until March 2008, LG Display was presented as an equity-accounted
investee. At the end of February 2008, Philips’ influence on LG Display’s
operating and financial policies, including representation on the LG
Display board, was reduced. Consequently, the 19.9% investment in
LG Display was transferred from investments in equity-accounted
investees to available-for-sale securities effective March 1, 2008, as
Philips was no longer able to exercise significant influence. The
investment in LG Display was reduced on March 12, 2008, when
24 million shares were sold in a capital market transaction to third
parties. The EUR 83 million gain on this transaction was presented in
Financial income and expense. At December 31, 2008, Philips owned
13.2% of LG Display’s share capital. At year-end the fair value based
on the stock price of LG Display was EUR 596 million below the
carrying value (fair value plus losses recognized in accumulated other
comprehensive income). As this loss was considered other than
temporary, an impairment charge
of EUR 596 million was recorded
by releasing the accumulated amounts
under Other comprehensive
income to Financial income and expense.
In April 2008, the Company obtained 64.5 million shares in Pace
in exchange for the transfer of the Company’s Set-Top Boxes and
Connectivity Solutions activities. Subsequently, 13.8 million shares were
sold to third parties. The EUR 1 million loss on this transaction was
presented under Financial income and expenses. As of December 31,
2008, Philips owns 17% of Pace’s share capital. At year-end the fair
value based on the stock price of Pace was EUR 30 million below the
carrying value (fair value plus losses recognized in accumulated other
comprehensive income). As this loss was considered other than
temporary, an impairment charge of EUR 30 million was recorded
by releasing the accumulated amounts under Other comprehensive
income to Financial income and expense.
Cost-method investments
The major cost-method investment as of December 31, 2008 is NXP,
for an amount of EUR 255 million, of which the Company holds 19.8%
of the common shares. The interest in NXP resulted from the sale of
a majority stake in the Semiconductors division in September 2006.
The Company’s stake in NXP is considered a non-core activity that is
available for sale. Although the ultimate method of disposal and the
precise market for non-listed shares are not clear, the disposal could
be effected, for example, by way of a private transaction to strategic
buyers or other financial parties, or via a public offering. The
Company does not have any definitive plans to dispose of this interest.
NXP is a privately held company that is not quoted in an active market.
NXP is carried at cost because the fair value is not readily determinable.
The variability in the range of reasonable fair value estimates is
significant and the probabilities of the various estimates within the
range of reasonable inputs are not sufficiently reliable to determine a
fair value. This is mainly due to the nature of the majority
shareholders (private equity firms) and their potentially volatile
investment and exit strategy, as well as to the nature and limited
availability of the financial projections of NXP. Triggered by the
deteriorating economic environment of the semiconductors industry
in general and the weakening financial performance of NXP specifically,
Philips performed impairment reviews on the carrying value of the
investment in NXP in 2007 and 2008. During 2008, impairment charges
were recognized in the amount of EUR 599 million, which are
presented in Financial income and expenses. Our impairment calculations
in 2008 indicated a broad range of valuations. The primary valuation
techniques considered in determining the estimated fair value ranges
comprise multiplier calculations (“EBITDA multiples”), calculations
based on the share price performance of a peer group of listed
(semiconductor) companies and discounted cash flow methods based
on unobservable inputs. The latter methodology involved estimates of
revenues, expenses, capital spending and other costs, as well as a
discount rate calculated based on the risk profile of the semiconductor
industry. As a result, the investment is classified within level 3 of the
fair-value hierarchy, which is measured at fair value on a non-recurring
basis. Taking into account certain market considerations and the range
of estimated fair values, management determined that the best
estimate of fair value for the NXP investment was EUR 255 million
at December 31, 2008. However, as noted above, the fair value used
for impairment purposes represents an estimate; the actual fair value
of this interest could materially differ from that estimate.
Another significant cost-method investment is an investment in TPO
Displays Corp. (TPO). The Company obtained a 17.4% stake in
TPO, after the merger of MDS with TPO in 2006. The value of the
investment at amortized cost is EUR 32 million, net of impairments.
The Company performed impairment reviews of the TPO investment,
which resulted in an impairment charge of EUR 71 million in 2008 and
Philips Annual Report 2008156
180
Sustainability performance
192
IFRS financial statements
244
Company financial statements
124
US GAAP financial statements
Notes to the US GAAP
financial statements