Philips 2008 Annual Report Download - page 160
Download and view the complete annual report
Please find page 160 of the 2008 Philips annual report below. You can navigate through the pages in the report by either clicking on the pages listed below, or by using the keyword search tool below to find specific information within the annual report.-
 1
1 -
2
-
3
-
4
-
5
-
6
-
7
-
8
-
9
-
10
-
11
-
12
-
13
-
14
-
15
-
16
-
17
-
18
-
19
-
20
-
21
-
22
-
23
-
24
-
25
-
26
-
27
-
28
-
29
-
30
-
31
-
32
-
33
-
34
-
35
-
36
-
37
-
38
-
39
-
40
-
41
-
42
-
43
-
44
-
45
-
46
-
47
-
48
-
49
-
50
-
51
-
52
-
53
-
54
-
55
-
56
-
57
-
58
-
59
-
60
-
61
-
62
-
63
-
64
-
65
-
66
-
67
-
68
-
69
-
70
-
71
-
72
-
73
-
74
-
75
-
76
-
77
-
78
-
79
-
80
-
81
-
82
-
83
-
84
-
85
-
86
-
87
-
88
-
89
-
90
-
91
-
92
-
93
-
94
-
95
-
96
-
97
-
98
-
99
-
100
-
101
-
102
-
103
-
104
-
105
-
106
-
107
-
108
-
109
-
110
-
111
-
112
-
113
-
114
-
115
-
116
-
117
-
118
-
119
-
120
-
121
-
122
-
123
-
124
-
125
-
126
-
127
-
128
-
129
-
130
-
131
-
132
-
133
-
134
-
135
-
136
-
137
-
138
-
139
-
140
-
141
-
142
-
143
-
144
-
145
-
146
-
147
-
148
-
149
-
 150
150 -
 151
151 -
 152
152 -
 153
153 -
 154
154 -
 155
155 -
 156
156 -
 157
157 -
 158
158 -
 159
159 -
 160
160 -
 161
161 -
 162
162 -
 163
163 -
 164
164 -
 165
165 -
 166
166 -
 167
167 -
 168
168 -
 169
169 -
 170
170 -
171
-
172
-
173
-
174
-
175
-
176
-
177
-
178
-
179
-
180
-
181
-
182
-
183
-
184
-
185
-
186
-
187
-
188
-
189
-
190
-
191
-
192
-
193
-
194
-
195
-
196
-
197
-
198
-
199
-
200
-
201
-
202
-
203
-
204
-
205
-
206
-
207
-
208
-
209
-
210
-
211
-
212
-
213
-
214
-
215
-
216
-
217
-
218
-
219
-
220
-
221
-
222
-
223
-
224
-
225
-
226
-
227
-
228
-
229
-
230
-
231
-
232
-
233
-
234
-
235
-
236
-
237
-
238
-
239
-
240
-
241
-
242
-
243
-
244
-
245
-
246
-
247
-
248
-
249
-
250
-
251
-
252
-
253
-
254
-
255
-
256
-
257
-
258
-
259
-
260
-
261
-
262
-
263
-
264
-
265
-
266
-
267
-
268
-
269
-
270
-
271
-
272
-
273
-
274
-
275
-
276
 |
 |

20
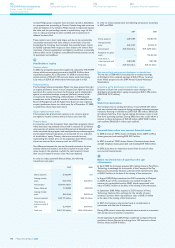
Pensions
Employee pension plans have been established in many countries
in accordance with the legal requirements, customs and the local
situation in the countries involved. The majority of employees in
Europe and North America are covered by defined-benefit pension
plans. The benefits provided by these plans are based on employees’
years of service and compensation levels. The measurement date
for all defined-benefit pension plans is December 31.
The Company’s contributions to the funding of defined-benefit plans
are determined based upon various factors, including funded status,
legal and tax considerations as well as local customs.
2006 2007 2008
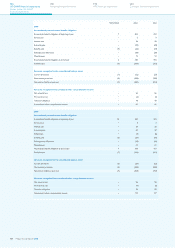
Summary of pre-tax costs for
pension plans and retiree
healthcare plans
Defined-benefit plans 75 27 10
Defined-contribution plans incl.
multi-employer plans 80 84 96
Retiree medical plans (see note 21) 39 36 47
194 147 153
The Company funds certain defined-benefit pension plans as claims are
incurred. The projected and accumulated benefit obligations for both
unfunded defined-benefit pension plans and funded defined-benefit
plans with accumulated benefit obligations in excess of the fair values
of their plan assets, are presented in the table below. It also provides
the respective aggregates of these fair values:
2007 2008
Projected benefit obligation 4,476 5,741
Accumulated benefit obligation 4,356 5,623
Fair value of plan assets 3,445 4,057
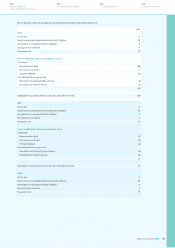
The table below provides a summary of the changes in the projected
benefit obligations for defined-benefit pension plans and the fair value
of their assets for 2008 and 2007. It also provides a reconciliation of
the funded status of these plans to the amounts recognized in the
consolidated balance sheets.
2007 2008
Netherlands other total Netherlands other total
Projected benefit obligation
Projected benefit obligation at beginning of year 12,396 8,014 20,410 11,260 7,419 18,679
Service cost 147 118 265 135 84 219
Interest cost 521 399 920 524 398 922
Employee contributions −44−44
Actuarial (gains) losses (670) (86) (756) (789) (393) (1,182)
Plan amendments −44−11
Settlements (435) (67) (502)1) −(22) (22)
Curtailments −22−(1) (1)
Changes in consolidation −49 49 −106 106
Benefits paid (700) (452) (1,152) (733) (457) (1,190)
Exchange rate differences −(564) (564) −(688) (688)
Miscellaneous 1 (2) (1) (3) 1 (2)
Projected benefit obligation at end of year 11,260 7,419 18,679 10,394 6,452 16,846
Present value of funded obligations at end of year 11,245 6,621 17,866 10,384 5,701 16,085
Present value of unfunded obligations at end of year 15 798 813 10 751 761
Plan assets
Fair value of plan assets at beginning of year 14,521 6,831 21,352 13,771 6,429 20,200
Actual return on plan assets 320 325 645 (174) (618) (792)
Employee contributions −44−44
Employer contributions 145 187 332 136 48 184
Settlements (516) (61) (577)1) −(22) (22)
Changes in consolidations −53 53 −88 88
Benefits paid (700) (383) (1,083) (730) (383) (1,113)
Exchange rate differences −(525) (525) −(651) (651)
Miscellaneous 1 (2) (1) −11
Fair value of plan assets at end of year 13,771 6,429 20,200 13,003 4,896 17,899
Funded status 2,511 (990) 1,521 2,609 (1,556) 1,053
Of which EUR (473) million (PBO) and EUR (560) million (Assets) is discontinued operations
1)
Philips Annual Report 2008160
180
Sustainability performance
192
IFRS financial statements
244
Company financial statements
124
US GAAP financial statements
Notes to the US GAAP
financial statements