Philips 2008 Annual Report Download - page 56
Download and view the complete annual report
Please find page 56 of the 2008 Philips annual report below. You can navigate through the pages in the report by either clicking on the pages listed below, or by using the keyword search tool below to find specific information within the annual report.-
 1
1 -
2
-
3
-
4
-
5
-
6
-
7
-
8
-
9
-
10
-
11
-
12
-
13
-
14
-
15
-
16
-
17
-
18
-
19
-
20
-
21
-
22
-
23
-
24
-
25
-
26
-
27
-
28
-
29
-
30
-
31
-
32
-
33
-
34
-
35
-
36
-
37
-
38
-
39
-
40
-
41
-
42
-
43
-
44
-
45
-
 46
46 -
 47
47 -
 48
48 -
 49
49 -
 50
50 -
 51
51 -
 52
52 -
 53
53 -
 54
54 -
 55
55 -
 56
56 -
 57
57 -
 58
58 -
 59
59 -
 60
60 -
 61
61 -
 62
62 -
 63
63 -
 64
64 -
 65
65 -
 66
66 -
67
-
68
-
69
-
70
-
71
-
72
-
73
-
74
-
75
-
76
-
77
-
78
-
79
-
80
-
81
-
82
-
83
-
84
-
85
-
86
-
87
-
88
-
89
-
90
-
91
-
92
-
93
-
94
-
95
-
96
-
97
-
98
-
99
-
100
-
101
-
102
-
103
-
104
-
105
-
106
-
107
-
108
-
109
-
110
-
111
-
112
-
113
-
114
-
115
-
116
-
117
-
118
-
119
-
120
-
121
-
122
-
123
-
124
-
125
-
126
-
127
-
128
-
129
-
130
-
131
-
132
-
133
-
134
-
135
-
136
-
137
-
138
-
139
-
140
-
141
-
142
-
143
-
144
-
145
-
146
-
147
-
148
-
149
-
150
-
151
-
152
-
153
-
154
-
155
-
156
-
157
-
158
-
159
-
160
-
161
-
162
-
163
-
164
-
165
-
166
-
167
-
168
-
169
-
170
-
171
-
172
-
173
-
174
-
175
-
176
-
177
-
178
-
179
-
180
-
181
-
182
-
183
-
184
-
185
-
186
-
187
-
188
-
189
-
190
-
191
-
192
-
193
-
194
-
195
-
196
-
197
-
198
-
199
-
200
-
201
-
202
-
203
-
204
-
205
-
206
-
207
-
208
-
209
-
210
-
211
-
212
-
213
-
214
-
215
-
216
-
217
-
218
-
219
-
220
-
221
-
222
-
223
-
224
-
225
-
226
-
227
-
228
-
229
-
230
-
231
-
232
-
233
-
234
-
235
-
236
-
237
-
238
-
239
-
240
-
241
-
242
-
243
-
244
-
245
-
246
-
247
-
248
-
249
-
250
-
251
-
252
-
253
-
254
-
255
-
256
-
257
-
258
-
259
-
260
-
261
-
262
-
263
-
264
-
265
-
266
-
267
-
268
-
269
-
270
-
271
-
272
-
273
-
274
-
275
-
276
 |
 |

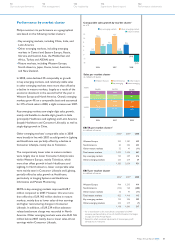
Liquidity
and capital
resources
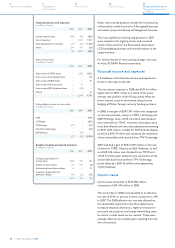
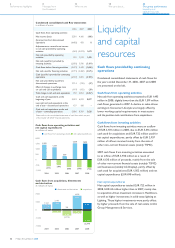
Cash flows provided by continuing
operations
Condensed consolidated statements of cash flows for
the years ended December 31, 2006, 2007 and 2008
are presented on the left.
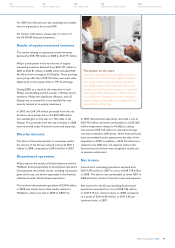
Cash flows from operating activities
Net cash from operating activities amounted to EUR 1,495
million in 2008, slightly lower than the EUR 1,519 million
cash flows generated in 2007. A decline in sales-driven
earnings in Consumer Lifestyle was largely offset by
lower working capital requirements in
most sectors
and the positive cash contributions from acquisitions.
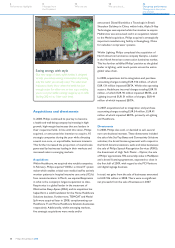
Cash flows from investing activities
Cash flows from investing activities were an outflow
of EUR 3,101 million in 2008, due to EUR 5,316 million
cash used for acquisitions and EUR 722 million used for
net capital expenditures, partly offset by EUR 2,937
million of inflows received mainly from the sale of
other non-current financial assets (mainly TSMC).
2007 cash flows from investing activities amounted
to an inflow of EUR 3,930 million as a result of
EUR 6,130 million of proceeds, mainly from the sale
of other non-current financial assets (notably TSMC)
and businesses (notably LG Display), partly offset by
cash used for acquisitions (EUR 1,502 million) and net
capital expenditures (EUR 698 million).
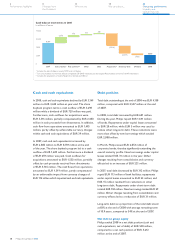
Net capital expenditures
Net capital expenditures totaled EUR 722 million in
2008, EUR 24 million higher than in 2007, mainly due
to acquisition-driven investment increases in Healthcare,
as well as higher investments in solid-state lighting at
Lighting. These higher investments were partly offset
by higher proceeds from the sale of real estate within
Group Management & Services.
Condensed consolidated cash flow statements
in millions of euros
2006 2007 2008
Cash flows from operating activities:
Net income (loss) 5,381 4,160 (186)
(Income) loss from discontinued
operations (4,482) 433 8
Adjustments to reconcile net income
to net cash provided by operating
activities (569) (3,074) 1,673
Net cash provided by operating
activities 330 1,519 1,495
Net cash (used for) provided by
investing activities (2,802) 3,930 (3,101)
Cash flows before financing activities (2,472) 5,449 (1,606)
Net cash used for financing activities (3,715) (2,368) (3,575)
Cash (used for) provided by continuing
operations (6,187) 3,081 (5,181)
Net cash provided by (used for)
discontinued operations 7,114 (115) (37)
Effect of changes in exchange rates
on cash and cash equivalents (197) (112) (39)
Total change in cash and cash equivalents
730 2,854 (5,257)
Cash and cash equivalents at the
beginning of year 5,293 6,023 8,877
Less cash and cash equivalents at the
end of year - discontinued operations 137 108 −
Cash and cash equivalents at the end
of year - continuing operations 5,886 8,769 3,620
Please refer to the consolidated statements of cash flows which are part
of the chapter US GAAP financial statements.
Cash flows from operating activities and
net capital expenditures
in millions of euros
cash flows from operating activities net capital expenditures
2,000
1,500
1,000
500
0
(500)
(1,000)
1,392
(613)
2004
1,147
(499)
2005
330
(688)
2006
1,519
(698)
2007
1,495
(722)
2008
Cash flows from acquisitions, divestments
and derivatives
in millions of euros
divestments and derivatives acquisitions
7,000
3,500
0
(3,500)
(7,000)
2,318
(371)
1,947
2004
3,346
(1,153)
2,193
384
2005
384
(2,498)
(2,114)
2006
6,130
(1,502)
4,628
2007
2,937
(5,316)
(2,379)
2008
Philips Annual Report 200856
42
Our group performance
Liquidity and
capital resources
18
We care about...
8
Message from
the President
6
Performance highlights
14
Who we are