Philips 2008 Annual Report Download - page 173
Download and view the complete annual report
Please find page 173 of the 2008 Philips annual report below. You can navigate through the pages in the report by either clicking on the pages listed below, or by using the keyword search tool below to find specific information within the annual report.-
 1
1 -
2
-
3
-
4
-
5
-
6
-
7
-
8
-
9
-
10
-
11
-
12
-
13
-
14
-
15
-
16
-
17
-
18
-
19
-
20
-
21
-
22
-
23
-
24
-
25
-
26
-
27
-
28
-
29
-
30
-
31
-
32
-
33
-
34
-
35
-
36
-
37
-
38
-
39
-
40
-
41
-
42
-
43
-
44
-
45
-
46
-
47
-
48
-
49
-
50
-
51
-
52
-
53
-
54
-
55
-
56
-
57
-
58
-
59
-
60
-
61
-
62
-
63
-
64
-
65
-
66
-
67
-
68
-
69
-
70
-
71
-
72
-
73
-
74
-
75
-
76
-
77
-
78
-
79
-
80
-
81
-
82
-
83
-
84
-
85
-
86
-
87
-
88
-
89
-
90
-
91
-
92
-
93
-
94
-
95
-
96
-
97
-
98
-
99
-
100
-
101
-
102
-
103
-
104
-
105
-
106
-
107
-
108
-
109
-
110
-
111
-
112
-
113
-
114
-
115
-
116
-
117
-
118
-
119
-
120
-
121
-
122
-
123
-
124
-
125
-
126
-
127
-
128
-
129
-
130
-
131
-
132
-
133
-
134
-
135
-
136
-
137
-
138
-
139
-
140
-
141
-
142
-
143
-
144
-
145
-
146
-
147
-
148
-
149
-
150
-
151
-
152
-
153
-
154
-
155
-
156
-
157
-
158
-
159
-
160
-
161
-
162
-
 163
163 -
 164
164 -
 165
165 -
 166
166 -
 167
167 -
 168
168 -
 169
169 -
 170
170 -
 171
171 -
 172
172 -
 173
173 -
 174
174 -
 175
175 -
 176
176 -
 177
177 -
 178
178 -
 179
179 -
 180
180 -
 181
181 -
 182
182 -
 183
183 -
184
-
185
-
186
-
187
-
188
-
189
-
190
-
191
-
192
-
193
-
194
-
195
-
196
-
197
-
198
-
199
-
200
-
201
-
202
-
203
-
204
-
205
-
206
-
207
-
208
-
209
-
210
-
211
-
212
-
213
-
214
-
215
-
216
-
217
-
218
-
219
-
220
-
221
-
222
-
223
-
224
-
225
-
226
-
227
-
228
-
229
-
230
-
231
-
232
-
233
-
234
-
235
-
236
-
237
-
238
-
239
-
240
-
241
-
242
-
243
-
244
-
245
-
246
-
247
-
248
-
249
-
250
-
251
-
252
-
253
-
254
-
255
-
256
-
257
-
258
-
259
-
260
-
261
-
262
-
263
-
264
-
265
-
266
-
267
-
268
-
269
-
270
-
271
-
272
-
273
-
274
-
275
-
276
 |
 |

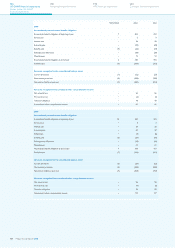
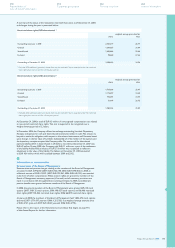
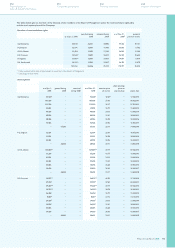
A summary of the status of the Company’s restricted share plans as of December 31, 2008
and changes during the year is presented below:
Restricted share rights, EUR-denominated 1)
shares
weighted average grant-date fair
value
Outstanding at January 1, 2008 2,357,377 26.97
Granted 1,209,327 21.64
Vested/Issued 1,089,446 25.46
Forfeited 78,658 27.34
Outstanding at December 31, 2008 2,398,600 24.96
Excludes 20% additional (premium) shares that may be received if shares awarded under the restricted
1)
share rights plan are not sold for a three-year period.
Restricted share rights, USD-denominated 1)
shares
weighted average grant-date fair
value
Outstanding at January 1, 2008 1,717,369 35.47
Granted 1,112,307 33.38
Vested/Issued 775,093 33.44
Forfeited 71,079 35.75
Outstanding at December 31, 2008 1,983,504 35.09
Excludes 20% additional (premium) shares that may be received if shares awarded under the restricted
1)
share rights plan are not sold for a three-year period.
At December 31, 2008, a total of EUR 63 million of unrecognized compensation cost related
to non-vested restricted share rights. This cost is expected to be recognized over a
weighted-average period of 2.3 years.
In December 2006, the Company offered to exchange outstanding Lumileds Depository
Receipts and options for cash and shared-based instruments settled in cash. The amount to
be paid to settle the obligation, with respect to share-based instruments, will fluctuate based
upon changes in the fair value of Lumileds. Substantially all of the holders of the options and
the depository receipts accepted the Company offer. The amount of the share-based
payment liability, which is denominated in US dollars, recorded at December 31, 2007 was
EUR 49 million. During 2008, the Company paid EUR 11 million as a part of the settlement
of the liability. Additionally, a release of EUR 27.6 million was recognized to reflect an
adjustment to the value of the liability. The balance at December 31, 2008 amounted
to EUR 10.4 million which will be settled between 2009 and 2012.
34
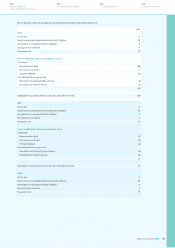
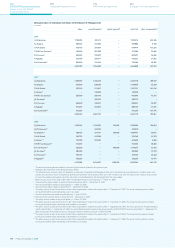
Information on remuneration
Remuneration of the Board of Management
Remuneration and pension charges relating to the members of the Board of Management
amounted to EUR 6,992,350 (2007: EUR 8,732,378, 2006: EUR 9,090,403). In 2008, an
additional amount
of EUR 619,252 (2007: EUR 739,861, 2006: EUR 645,123) was awarded
in the form of other compensation. When pension rights are granted to members of the
Board of Management, necessary payments (if insured) and all necessary provisions are
made in accordance with the applicable accounting principles. In 2008, no (additional)
pension
benefits were granted to former members of the Board of Management.
In 2008, the present members of the Board of Management were granted 259,218 stock
options (2007: 318,132 stock options, 2006: 198,027 stock options) and 86,406 restricted
share rights (2007: 106,044 restricted share rights; 2006: 66,009 restricted share rights).
At year-end 2008, the members of the Board of Management held 1,805,672 stock options
(year-end 2007: 1,771,097; year-end 2006: 1,355,765) at a weighted average exercise price
of EUR 27.31 (year-end 2007: EUR 28.05; year-end 2006: EUR 27.70).
Please refer to the report of the Remuneration Committee that begins on page 116
of this Annual Report for further information.
34
Philips Annual Report 2008 173
254
Corporate governance
250
Reconciliation of
non-US GAAP information
262
Ten-year overview
266
Investor information