Philips 2008 Annual Report Download - page 183
Download and view the complete annual report
Please find page 183 of the 2008 Philips annual report below. You can navigate through the pages in the report by either clicking on the pages listed below, or by using the keyword search tool below to find specific information within the annual report.-
 1
1 -
2
-
3
-
4
-
5
-
6
-
7
-
8
-
9
-
10
-
11
-
12
-
13
-
14
-
15
-
16
-
17
-
18
-
19
-
20
-
21
-
22
-
23
-
24
-
25
-
26
-
27
-
28
-
29
-
30
-
31
-
32
-
33
-
34
-
35
-
36
-
37
-
38
-
39
-
40
-
41
-
42
-
43
-
44
-
45
-
46
-
47
-
48
-
49
-
50
-
51
-
52
-
53
-
54
-
55
-
56
-
57
-
58
-
59
-
60
-
61
-
62
-
63
-
64
-
65
-
66
-
67
-
68
-
69
-
70
-
71
-
72
-
73
-
74
-
75
-
76
-
77
-
78
-
79
-
80
-
81
-
82
-
83
-
84
-
85
-
86
-
87
-
88
-
89
-
90
-
91
-
92
-
93
-
94
-
95
-
96
-
97
-
98
-
99
-
100
-
101
-
102
-
103
-
104
-
105
-
106
-
107
-
108
-
109
-
110
-
111
-
112
-
113
-
114
-
115
-
116
-
117
-
118
-
119
-
120
-
121
-
122
-
123
-
124
-
125
-
126
-
127
-
128
-
129
-
130
-
131
-
132
-
133
-
134
-
135
-
136
-
137
-
138
-
139
-
140
-
141
-
142
-
143
-
144
-
145
-
146
-
147
-
148
-
149
-
150
-
151
-
152
-
153
-
154
-
155
-
156
-
157
-
158
-
159
-
160
-
161
-
162
-
163
-
164
-
165
-
166
-
167
-
168
-
169
-
170
-
171
-
172
-
 173
173 -
 174
174 -
 175
175 -
 176
176 -
 177
177 -
 178
178 -
 179
179 -
 180
180 -
 181
181 -
 182
182 -
 183
183 -
 184
184 -
 185
185 -
 186
186 -
 187
187 -
 188
188 -
 189
189 -
 190
190 -
 191
191 -
 192
192 -
 193
193 -
194
-
195
-
196
-
197
-
198
-
199
-
200
-
201
-
202
-
203
-
204
-
205
-
206
-
207
-
208
-
209
-
210
-
211
-
212
-
213
-
214
-
215
-
216
-
217
-
218
-
219
-
220
-
221
-
222
-
223
-
224
-
225
-
226
-
227
-
228
-
229
-
230
-
231
-
232
-
233
-
234
-
235
-
236
-
237
-
238
-
239
-
240
-
241
-
242
-
243
-
244
-
245
-
246
-
247
-
248
-
249
-
250
-
251
-
252
-
253
-
254
-
255
-
256
-
257
-
258
-
259
-
260
-
261
-
262
-
263
-
264
-
265
-
266
-
267
-
268
-
269
-
270
-
271
-
272
-
273
-
274
-
275
-
276
 |
 |

Consumer Lifestyle
We signed an exclusive three-year agreement with Starwood Hotels
and Resorts, Inc. to provide our latest range of SmartPower2 energy
efficient hotel televisions to Starwood’s 460 properties across North
America. The deal will see these energy efficient televisions installed
in new hotels and existing Starwood properties looking to convert to
LCD TV technology for the first time.
This agreement is expected to save the hotel company more than
EUR 9 million in energy costs over the seven-year lifetime of the
equipment, and reduce energy consumption by up to 40% compared
with the televisions currently in use.
We continue to lower the standby power of our televisions, and have
brought it down to 0.15 watts in all of our TVs. Ten years ago some 8
to 9 watts were used for standby power.
Lighting
In the area of urban lighting, our new UrbanLine luminaire represents
a breakthrough into functional outdoor LED lighting. UrbanLine
delivers light in a sustainable and energy-efficient manner, while still
fulfilling all the requirements in terms of safety and city identification.
Featuring high-power LEDs combined with smart optics, UrbanLine
offers an environmentally friendly lighting solution – consuming up
to 50% less energy than traditional street lighting – by exploiting the
benefits of white light.
EcoVision4: Green Innovations
In 2008 Philips invested approximately EUR 282 million in Green
Innovations – the R&D spend related to the development of new
generations of Green Products and Green Technologies.
Healthcare
Philips Healthcare invested some EUR 54 million, concentrating on
innovation projects that consider all of the Green Focal Areas and
aim to reduce total life cycle impact. In particular the sector focuses
on reducing energy consumption, weight and hazardous substances.
One example is our holistic approach to radiation management
called DoseWise.
DoseWise is a set of techniques, programs and practices that ensures
optimal image quality, while protecting people in x-ray environments.
Based on our ALARA (As Low As Reasonably Achievable) principle,
this is a philosophy that is active in every level of product design. And
it includes creative thinking in three areas: X-ray Beam Management,
Less Radiation Time and More Dose Awareness.
Consumer Lifestyle
The Consumer Lifestyle sector invested about EUR 36 million in
Green Innovations. The sector is dedicated to developing new Green
Products with a sharp focus on further enhancing energy efficiency
and closing material loops, for example by using recycled materials
or offering better recyclability.
Lighting
The Lighting sector accounts for more than half of the total spend on
Green Innovations, investing some EUR 151 million. The focus is on
developing new energy-efficient lighting solutions, further enhancing
current Green Products and driving toward technological
breakthroughs, such as solid-state lighting.
Research
Within Corporate Technologies, Philips Research invested more than
EUR 41 million, spread over Green Innovation projects focused on
meeting global challenges related to water, air, waste and energy. One
example is a patented technology in solid-state lighting.
For all the acknowledged benefits of power LEDs, including efficiency,
sustainability and durability, one of the major challenges has been
customer acceptance of white LED light for general lighting. Philips
Lumileds Advanced Laboratories in San Jose and Philips Research in
Europe have addressed this issue, jointly developing a new technology
that ensures consistent delivery of uniformly high color-quality white
LEDs. This Lumiramic technology, patented by Philips, enables us to
produce white LEDs that offer better controlled warm white light.
EcoVision4: Operational energy efficiency and
carbon footprint
Determining our carbon footprint is a complex exercise. In the Philips
Sustainability Report 2007, we reported our operational carbon
footprint for the first time. Based on the available data, some of which
were estimated or extrapolated, we calculated our total operational
footprint to be approximately 2,350 kilotons CO2 equivalents.
During 2008 we further improved the data by collecting more
accurate figures and making less estimates and extrapolations. As a
result, we have recalculated our total operational carbon footprint for
2007 to approximately 2,127 kilotons CO2 equivalents, in order to
get a reliable comparison between 2007 and 2008.
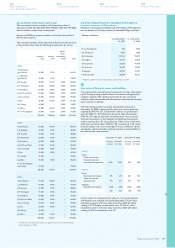
In absolute terms, total CO2 emissions in 2008 remained virtually flat
at 2,147 kilotons CO2 equivalents, mainly due to the major
acquisitions (Genlyte and Respironics). Without these additions, the
footprint would have decreased by nearly 5%.
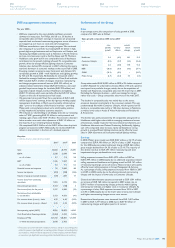
Operational carbon footprint
in kilotons CO2 equivalents
2007 2008
Manufacturing 940 962
Non-industrial operations 260 242
Business travel 266 244
Distribution 661 699
Total Philips Group 2,127 2,147
Our total operational carbon footprint can also be expressed
according to the three scopes of the Greenhouse Gas Protocol.
Operational carbon footprint by Greenhouse Gas Protocol scopes
in kilotons CO2 equivalents
2007 2008
Scope 1 460 484
Scope 2 740 720
Scope 3 927 943
Total Philips Group 2,127 2,147
Operational energy efficiency and carbon footprint: 2008 details
The 2008 results can be attributed to several factors:
The major acquisitions (Genlyte and Respironics) had a significant
•
impact on our total operational carbon footprint, with an upward
effect of nearly 6%. Without these additions, the footprint would
have decreased by nearly 5%.
Total CO
• 2 emissions from manufacturing increased 2% in absolute
terms, but decreased 4% on a comparable basis, excluding the
acquisitions. We doubled the percentage of electricity purchased
from renewable sources – up to 16% in 2008 from 8% in 2007 –
thereby reducing indirect CO2 emissions. Further, optimized
production reduced direct and indirect emissions. Additional
details on CO2 emissions from manufacturing operations are
provided under EcoVision III performance.
CO
• 2 emissions from non-industrial operations (offices, warehouses,
etc.) decreased 7% in absolute terms, and 15% after eliminating the
effect of new consolidations. We reduced facility space –
decreasing total square meters by 9% – mainly by centralizing and
re-allocating facilities.
The total level of CO
• 2 emissions related to business travel, which
represents 11% of the total, decreased 8% in absolute terms and
11% on a comparable basis, excluding the acquisitions. This
reduction was achieved through our strict air travel policy and
strong promotion of videoconferencing. While the number of lease
cars increased 5%, particularly related to acquisitions, total emissions
from lease cars remained virtually unchanged, as CO2 emissions
per car decreased 3%, attributable to our green lease car policy.
Philips Annual Report 2008 183
254
Corporate governance
250
Reconciliation of
non-US GAAP information
262
Ten-year overview
266
Investor information