Philips 2008 Annual Report Download - page 194
Download and view the complete annual report
Please find page 194 of the 2008 Philips annual report below. You can navigate through the pages in the report by either clicking on the pages listed below, or by using the keyword search tool below to find specific information within the annual report.-
 1
1 -
2
-
3
-
4
-
5
-
6
-
7
-
8
-
9
-
10
-
11
-
12
-
13
-
14
-
15
-
16
-
17
-
18
-
19
-
20
-
21
-
22
-
23
-
24
-
25
-
26
-
27
-
28
-
29
-
30
-
31
-
32
-
33
-
34
-
35
-
36
-
37
-
38
-
39
-
40
-
41
-
42
-
43
-
44
-
45
-
46
-
47
-
48
-
49
-
50
-
51
-
52
-
53
-
54
-
55
-
56
-
57
-
58
-
59
-
60
-
61
-
62
-
63
-
64
-
65
-
66
-
67
-
68
-
69
-
70
-
71
-
72
-
73
-
74
-
75
-
76
-
77
-
78
-
79
-
80
-
81
-
82
-
83
-
84
-
85
-
86
-
87
-
88
-
89
-
90
-
91
-
92
-
93
-
94
-
95
-
96
-
97
-
98
-
99
-
100
-
101
-
102
-
103
-
104
-
105
-
106
-
107
-
108
-
109
-
110
-
111
-
112
-
113
-
114
-
115
-
116
-
117
-
118
-
119
-
120
-
121
-
122
-
123
-
124
-
125
-
126
-
127
-
128
-
129
-
130
-
131
-
132
-
133
-
134
-
135
-
136
-
137
-
138
-
139
-
140
-
141
-
142
-
143
-
144
-
145
-
146
-
147
-
148
-
149
-
150
-
151
-
152
-
153
-
154
-
155
-
156
-
157
-
158
-
159
-
160
-
161
-
162
-
163
-
164
-
165
-
166
-
167
-
168
-
169
-
170
-
171
-
172
-
173
-
174
-
175
-
176
-
177
-
178
-
179
-
180
-
181
-
182
-
183
-
 184
184 -
 185
185 -
 186
186 -
 187
187 -
 188
188 -
 189
189 -
 190
190 -
 191
191 -
 192
192 -
 193
193 -
 194
194 -
 195
195 -
 196
196 -
 197
197 -
 198
198 -
 199
199 -
 200
200 -
 201
201 -
 202
202 -
 203
203 -
 204
204 -
205
-
206
-
207
-
208
-
209
-
210
-
211
-
212
-
213
-
214
-
215
-
216
-
217
-
218
-
219
-
220
-
221
-
222
-
223
-
224
-
225
-
226
-
227
-
228
-
229
-
230
-
231
-
232
-
233
-
234
-
235
-
236
-
237
-
238
-
239
-
240
-
241
-
242
-
243
-
244
-
245
-
246
-
247
-
248
-
249
-
250
-
251
-
252
-
253
-
254
-
255
-
256
-
257
-
258
-
259
-
260
-
261
-
262
-
263
-
264
-
265
-
266
-
267
-
268
-
269
-
270
-
271
-
272
-
273
-
274
-
275
-
276
 |
 |

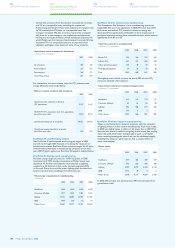
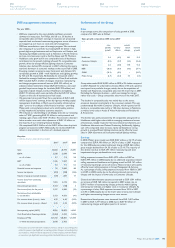
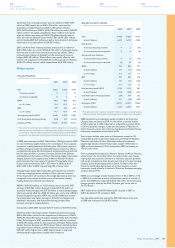
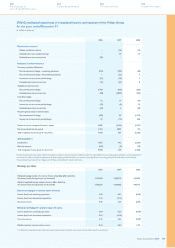
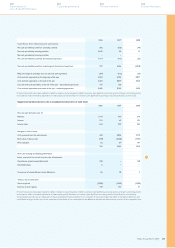
The following overview shows sales, EBIT and EBITA according
to the 2008 sector classification.
Sales, EBIT and EBITA 2008
in millions of euros unless otherwise stated
sales EBIT % EBITA %
Healthcare 7,649 645 8.4 863 11.3
Consumer Lifestyle 11,145 136 1.2 152 1.4
Lighting 7,106 14 0.2 470 6.6
I&EB 337 (247) (73.3) (247) (73.3)
GM&S 148 (494) −(494) −
Philips Group 26,385 54 0.2 744 2.8
Sales, EBIT and EBITA 20071)
in millions of euros unless otherwise stated
sales EBIT % EBITA %
Healthcare 6,638 724 10.9 861 13.0
Consumer Lifestyle 13,330 837 6.3 853 6.4
Lighting 6,093 637 10.5 711 11.7
I&EB 535 (104) (19.4) (104) (19.4)
GM&S 197 (227) −(227) −
Philips Group 26,793 1,867 7.0 2,094 7.8
1)
Prior-period amounts have been restated to reflect a change in accounting policy
related to pensions (see Significant accounting policies, Change in
accounting policy)
and revised to reflect immaterial adjustments of intercompany
profit elimination
on inventory (see Significant accounting policies, Reclassifications
and revisions)
In 2008, EBIT declined by EUR 1,813 million compared to 2007, to
EUR 54 million. EBIT included a EUR 299 million non-cash goodwill
impairment for Lumileds. EBIT and EBITA were both impacted by
EUR 535 million restructuring charges and EUR 131 million of
acquisition-related charges, as well as a EUR 264 million asbestos-
related settlement charge. 2007 included EUR 37 million of restructuring
charges and EUR 41 million of acquisition-related charges.
Adjusted for the aforementioned charges, EBITA declined from 8.1%
of sales to 7.4% in 2008, largely due to lower sales at Consumer
Lifestyle and lower license income at Innovation & Emerging Businesses.
Healthcare’s EBITA of EUR 863 million was in line with 2007 and
included EUR 63 million of restructuring charges and EUR 90 million
of acquisition-related costs, partially offset by a EUR 45 million gain on
the sale of Philips Speech Recognition Services. In 2007, acquisition-
related charges were EUR 11 million. As a percentage of sales, EBITA
declined from 13.0% in 2007 to 11.3% in 2008. However, adjusted for
the aforementioned items, EBITA profitability was 12.7% in relation to
sales, broadly in line with 2007.
Consumer Lifestyle’s EBITA declined from EUR 853 million in 2007
to EUR 152 million in 2008, largely due to lower sales-driven earnings
in all businesses except Health & Wellness and Domestic Appliances,
deteriorating margins within Television, and restructuring charges of
EUR 192 million. The sector’s 2008 EBITA included a EUR 42 million
gain on the sale of the Set-Top Boxes activity.
EBITA at Lighting declined from EUR 711 million, or 11.7% of sales, in
2007 to EUR 470 million, or 6.6% of sales, in 2008. Additional earnings
from acquisitions were offset by EUR 245 million of restructuring
charges, EUR 41 million of acquisition-related charges and margin
compression in mature markets. In 2007, restructuring and
acquisition-related charges were EUR 55 million.
The EBITA loss at Innovation & Emerging Businesses amounted to
EUR 247 million, compared to a loss of EUR 104 million in 2007.
The decline was mainly due to EUR 81 million lower license income,
EUR 18 million restructuring charges at Assembléon, a EUR 13 million
loss on the sale of the High Tech Plastics – Optics business, and higher
investments in the Healthcare and Lighting & Cleantech incubator
activities.
EBITA at Group Management and Services declined EUR 267 million
in 2008 to a loss of EUR 494 million, mainly due to a EUR 264 million
asbestos-related settlement charge. Adjusted for this settlement, GM&S
costs saw a year-on-year decline due to lower brand campaign spending.
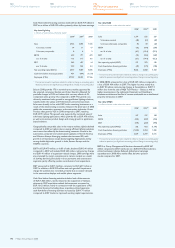
Financial income and expense
Financial income declined from EUR 2,849 million in 2007 to EUR 88
million in 2008, mainly due to the EUR 2,804 million of gains recorded
in 2007 related to the sale of shares in TSMC, Nuance and JDS Uniphase.
In 2008, a total gain of EUR 1,406 million was recognized from the sale
of stakes in mainly TSMC and LG Display, mostly offset by non-cash
value adjustments amounting to EUR 1,148 million, notably on our
financial stakes in NXP and LG Display.
Income taxes
Income taxes amounted to EUR 256 million, compared to EUR 582
million in 2007. The lower tax burden was mainly due to the lower
sector earnings, as well as higher net interest expense.
The tax burden in 2008, however, corresponded to an effective tax
rate of 180% on pre-tax income, compared to 12% in 2007. The 2008
effective tax rate was affected by non-deductible impairment and value
adjustments, increased valuation allowances, higher provisions for
uncertain tax positions and foreign withholding taxes for which a
credit could not be realized. These were partially offset by non-taxable
gains resulting from the sale of securities.
For 2009, the effective tax rate excluding non-taxable items is
expected to be around 30%.
For further information, please refer to note 42.
Results relating to equity-accounted investees
The results related to equity-accounted investees declined by EUR 865
million in 2008 to EUR 19 million. Philips’ participation in the net income
of equity-accounted investees declined from EUR 246 million in 2007
to EUR 81 million in 2008, which included EUR 66 million from
earnings at LG Display. These earnings were partly offset by a EUR 59
million non-cash value adjustment on the equity stake in TPV Technology.
During 2008, as a result of the reduction in both Philips’ shareholding
and the number of Philips board members, LG Display was accounted
for as an available-for-sale security instead of an equity-accounted
investee.
In 2007, the EUR 660 million proceeds from the sale of shares were
mainly due to the EUR 654 million non-taxable gain on the sale of a
13% stake in LG Display. The proceeds from the sale of stakes in 2008
were recorded under Financial income and expenses.
Discontinued operations
Philips reports the results of Semiconductors and the MedQuist
business separately as discontinued operations. Consequently, the
related results, including transaction gains and losses, are shown
separately in the financial statements under Discontinued operations.
The gain from discontinued operations of EUR 3 million in 2008 was
mainly related to MedQuist, which was sold in 2008 to CBAY.
In 2007, discontinued operations recorded a loss of EUR 138 million,
primarily attributable to impairment charges for MedQuist and results
of the Semiconductors business.
Net income
Income from continuing operations declined from EUR 5,018 million
in 2007 to a loss of EUR 95 million in 2008. The decline was attributable
to lower EBIT in 2008, and lower results in financial income and
expenses, largely due to value adjustments on our financial stakes
in NXP and LG Display.
Net income for the Group including discontinued operations and
minority interests amounted to a loss of EUR 91 million, or EUR 0.09
per common share, in 2008, compared to a profit of EUR 4,873
million, or EUR 4.49 per common share, in 2007.
Cash flows before financing activities
Cash flows before financing activities were EUR 7.1 billion lower
than in 2007, primarily due to higher cash used for the acquisitions
of Respironics and Genlyte, as well as lower proceeds from the sale
of stakes in LG Display and TSMC.
Net cash from operating activities amounted to EUR 1,648 million
in 2008, below the EUR 1,752 million of cash flow generated in 2007.
This decline was mainly due to lower sales driven-earnings in
Consumer Lifestyle, largely offset by lower working capital requirements
in most sectors and positive contributions from acquisitions.
Philips Annual Report 2008194
180
Sustainability performance
244
Company financial statements
124
US GAAP financial statements
192
IFRS financial statements
IFRS management commentary