Philips 2008 Annual Report Download - page 6
Download and view the complete annual report
Please find page 6 of the 2008 Philips annual report below. You can navigate through the pages in the report by either clicking on the pages listed below, or by using the keyword search tool below to find specific information within the annual report.-
 1
1 -
 2
2 -
 3
3 -
 4
4 -
 5
5 -
 6
6 -
 7
7 -
 8
8 -
 9
9 -
 10
10 -
 11
11 -
 12
12 -
 13
13 -
 14
14 -
 15
15 -
 16
16 -
 17
17 -
18
-
19
-
20
-
21
-
22
-
23
-
24
-
25
-
26
-
27
-
28
-
29
-
30
-
31
-
32
-
33
-
34
-
35
-
36
-
37
-
38
-
39
-
40
-
41
-
42
-
43
-
44
-
45
-
46
-
47
-
48
-
49
-
50
-
51
-
52
-
53
-
54
-
55
-
56
-
57
-
58
-
59
-
60
-
61
-
62
-
63
-
64
-
65
-
66
-
67
-
68
-
69
-
70
-
71
-
72
-
73
-
74
-
75
-
76
-
77
-
78
-
79
-
80
-
81
-
82
-
83
-
84
-
85
-
86
-
87
-
88
-
89
-
90
-
91
-
92
-
93
-
94
-
95
-
96
-
97
-
98
-
99
-
100
-
101
-
102
-
103
-
104
-
105
-
106
-
107
-
108
-
109
-
110
-
111
-
112
-
113
-
114
-
115
-
116
-
117
-
118
-
119
-
120
-
121
-
122
-
123
-
124
-
125
-
126
-
127
-
128
-
129
-
130
-
131
-
132
-
133
-
134
-
135
-
136
-
137
-
138
-
139
-
140
-
141
-
142
-
143
-
144
-
145
-
146
-
147
-
148
-
149
-
150
-
151
-
152
-
153
-
154
-
155
-
156
-
157
-
158
-
159
-
160
-
161
-
162
-
163
-
164
-
165
-
166
-
167
-
168
-
169
-
170
-
171
-
172
-
173
-
174
-
175
-
176
-
177
-
178
-
179
-
180
-
181
-
182
-
183
-
184
-
185
-
186
-
187
-
188
-
189
-
190
-
191
-
192
-
193
-
194
-
195
-
196
-
197
-
198
-
199
-
200
-
201
-
202
-
203
-
204
-
205
-
206
-
207
-
208
-
209
-
210
-
211
-
212
-
213
-
214
-
215
-
216
-
217
-
218
-
219
-
220
-
221
-
222
-
223
-
224
-
225
-
226
-
227
-
228
-
229
-
230
-
231
-
232
-
233
-
234
-
235
-
236
-
237
-
238
-
239
-
240
-
241
-
242
-
243
-
244
-
245
-
246
-
247
-
248
-
249
-
250
-
251
-
252
-
253
-
254
-
255
-
256
-
257
-
258
-
259
-
260
-
261
-
262
-
263
-
264
-
265
-
266
-
267
-
268
-
269
-
270
-
271
-
272
-
273
-
274
-
275
-
276
 |
 |

0
5
10
15
2
0
25
i
n euros
2
004
1
)
2
00
7
1
)
2
005
1)
200
6
1
)
2
00
8
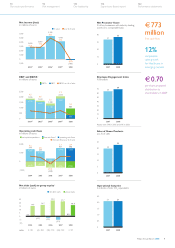
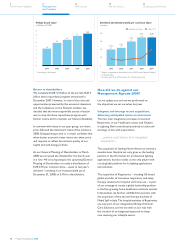
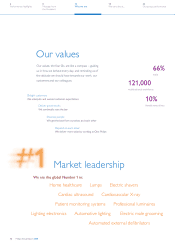
Equity and EBITA per common share
2)
stockholders’ equity per common share - basic
EBITA per common share - diluted
11.57
1.43
13.85
1.31
20.75
1.17 20.32
1.87 17.60
0.93 1.4
3.7
0.6
6.4
0.9
1.7
4.2
0.6
7.4
1.0
1.9
4.4
0.5
7.8
1.1
2.2
4.5
8.0
1.3
2.4
4.3
8.1
0
2
4
6
8
in billions of euros
2004 20072005 2006 2008
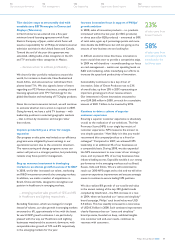
Sales per sector in emerging markets
5)
0.7
Healthcare LightingConsumer Lifestyle I&EB
0.2 0.1
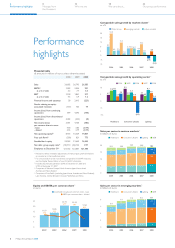
Financial table
all amounts in millions of euros unless otherwise stated
20061) 20071) 2008
Sales 26,682 26,793 26,385
EBITA2) 1,383 2,054 931
as a % of sales 5.2 7.7 3.5
EBIT 1,198 1,841 317
as a % of sales 4.5 6.9 1.2
Financial income and expenses 28 2,613 (225)
Results relating to equity-
accounted investees (157) 763 19
Income (loss) from continuing
operations 899 4,593 (178)
Income (loss) from discontinued
operations 4,482 (433) (8)
Net income (loss)
per common share in euros
- basic
- diluted
5,381
4.58
4.55
4,160
3.83
3.79
(186
(0.19
(0.19
)
)
)
Net operating capital2) 8,473 10,529 14,867
Free cash flows2) (358) 821 773
Stockholders’ equity 22,963 21,642 16,243
Net debt : group equity ratio2) (10):110 (32):132 3:97
Employees at December 313) 121,732 123,801 121,398
Revised to reflect immaterial adjustments of intercompany profit eliminations
1)
on inventories in the Healthcare sector
For a reconciliation to the most directly comparable US GAAP measures,
2)
see the chapter Reconciliation of non-US GAAP information
Includes discontinued operations 6,640 at December 31, 2006 and
3)
5,703 at December 31, 2007
Comprises of
4) Western Europe, North America, Japan, Korea, Israel,
Australia and New Zealand
Comprises of
5) Asia Pacific (excluding Japan, Korea, Australia and New Zealand),
Latin America, Central & Eastern Europe, Middle East and Africa
Comparable sales growth by market cluster
2)
as a %
19.9
8.0
4.2
11.7
4.5
1.8
6.5
6.4 6.3
10.2
4.9
2.8 3.8
(2.7)
(5.5)
2004 2005 2006 2007 2008
Philips Group emerging markets mature markets
20
0
4
12
16
(8)
(4)
8
4.8
3.1
8.2
2.0
18.1
5.0
3.2
8.3
1.5
18.0
5.4
3.6
8.7
18.9
0
5
10
15
20
in billions of euros
2004 20072005 2006 2008
Healthcare LightingConsumer Lifestyle I&EB
1.2
5.4
3.9
8.9
18.8
6.4
4.8
6.8
18.3
Sales per sector in mature markets
4)
0.6 0.3
Comparable sales growth by operating sector
2)
as a %
4.7
7.8 8.2
3.7
5.6
Healthcare
9.2
4.9
6.5
3.8
(8.5)
Consumer Lifestyle
5.1 4.0
8.3
6.0
2.6
Lighting
2004 2005 2006 2007 2008
0
5
(10)
(5)
10
Philips Annual Report 20086
18
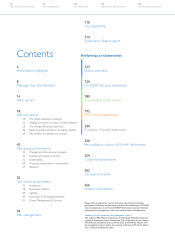
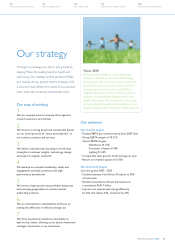
We care about...
8
Message from
the President
6
Performance highlights
14
Who we are
42
Our group performance
Performance
highlights