Philips 2008 Annual Report Download - page 52
Download and view the complete annual report
Please find page 52 of the 2008 Philips annual report below. You can navigate through the pages in the report by either clicking on the pages listed below, or by using the keyword search tool below to find specific information within the annual report.-
 1
1 -
2
-
3
-
4
-
5
-
6
-
7
-
8
-
9
-
10
-
11
-
12
-
13
-
14
-
15
-
16
-
17
-
18
-
19
-
20
-
21
-
22
-
23
-
24
-
25
-
26
-
27
-
28
-
29
-
30
-
31
-
32
-
33
-
34
-
35
-
36
-
37
-
38
-
39
-
40
-
41
-
 42
42 -
 43
43 -
 44
44 -
 45
45 -
 46
46 -
 47
47 -
 48
48 -
 49
49 -
 50
50 -
 51
51 -
 52
52 -
 53
53 -
 54
54 -
 55
55 -
 56
56 -
 57
57 -
 58
58 -
 59
59 -
 60
60 -
 61
61 -
 62
62 -
63
-
64
-
65
-
66
-
67
-
68
-
69
-
70
-
71
-
72
-
73
-
74
-
75
-
76
-
77
-
78
-
79
-
80
-
81
-
82
-
83
-
84
-
85
-
86
-
87
-
88
-
89
-
90
-
91
-
92
-
93
-
94
-
95
-
96
-
97
-
98
-
99
-
100
-
101
-
102
-
103
-
104
-
105
-
106
-
107
-
108
-
109
-
110
-
111
-
112
-
113
-
114
-
115
-
116
-
117
-
118
-
119
-
120
-
121
-
122
-
123
-
124
-
125
-
126
-
127
-
128
-
129
-
130
-
131
-
132
-
133
-
134
-
135
-
136
-
137
-
138
-
139
-
140
-
141
-
142
-
143
-
144
-
145
-
146
-
147
-
148
-
149
-
150
-
151
-
152
-
153
-
154
-
155
-
156
-
157
-
158
-
159
-
160
-
161
-
162
-
163
-
164
-
165
-
166
-
167
-
168
-
169
-
170
-
171
-
172
-
173
-
174
-
175
-
176
-
177
-
178
-
179
-
180
-
181
-
182
-
183
-
184
-
185
-
186
-
187
-
188
-
189
-
190
-
191
-
192
-
193
-
194
-
195
-
196
-
197
-
198
-
199
-
200
-
201
-
202
-
203
-
204
-
205
-
206
-
207
-
208
-
209
-
210
-
211
-
212
-
213
-
214
-
215
-
216
-
217
-
218
-
219
-
220
-
221
-
222
-
223
-
224
-
225
-
226
-
227
-
228
-
229
-
230
-
231
-
232
-
233
-
234
-
235
-
236
-
237
-
238
-
239
-
240
-
241
-
242
-
243
-
244
-
245
-
246
-
247
-
248
-
249
-
250
-
251
-
252
-
253
-
254
-
255
-
256
-
257
-
258
-
259
-
260
-
261
-
262
-
263
-
264
-
265
-
266
-
267
-
268
-
269
-
270
-
271
-
272
-
273
-
274
-
275
-
276
 |
 |

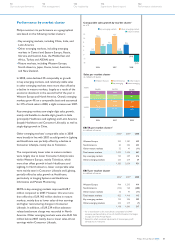
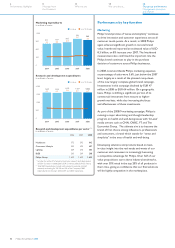
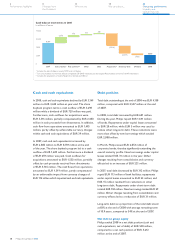
Marketing expenditures
in million of euros
in value as a % of sales
1,200
900
600
300
0
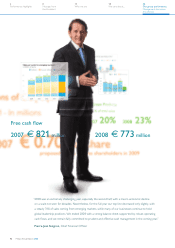
811
3.3
2004
829
3.3
2005
865
3.3
2006
994
3.7
2007
949
3.6
2008
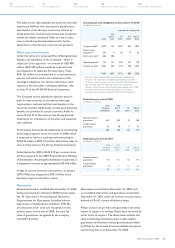
Research and development expenditures
in millions of euros
in value as a % of sales
2,000
1,500
1,000
500
0
1,609
6.6
2004
1,593
6.3
2005
1,659
6.2
2006
1,629
6.1
2007
1,622
6.1
2008
Performance by key function
Marketing
Philips’ brand promise of “sense and simplicity” continues
to drive innovation and customer experience across all
customer touch-points. As a result, in 2008 Philips
again achieved significant growth in its total brand
value. Interbrand reported an estimated value of USD
8.3 billion, an 8% increase over 2007. The Interbrand
measurement also confirmed the important role the
Philips brand continues to play in the purchase
decision of customers across Philips businesses.
In 2008, total worldwide Philips marketing expenses
as percentage of sales were 3.6%, just below the 2007
level, largely as a result of the planned ramp-down
of the now largely complete global brand campaign.
Investments in this campaign declined by EUR 47
million in 2008 to EUR 64 million. On a geographic
basis, Philips is shifting a significant portion of its
commercial investment from mature to higher-
growth markets, while also increasing the focus
and effectiveness of these investments.
As part of the 2008/9 marketing campaign, Philips is
running a major advertising and thought leadership
program on health and well-being issues with ‘A Level’
media owners such as CNN, CNBC, FT and The
Economist Group. The ultimate aim is to become the
brand of first choice among influencers, professionals
and consumers, a brand which stands for “sense and
simplicity” in the area of health and well-being.
Developing solutions and products based on best-
in-class insight into the real needs and wants of our
customer and consumers is increasingly becoming
a competitive advantage for Philips. Over half of our
value propositions score above industry benchmarks,
with over 30% rated in the top 20% of all products in
their class, giving us confidence that our final solutions
will be highly competitive in the marketplace.
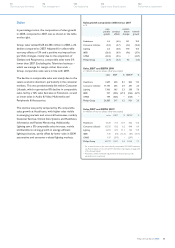
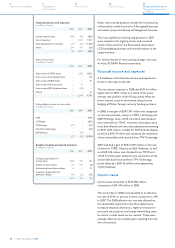
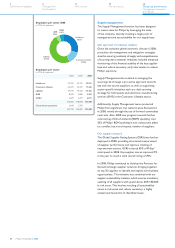
Research and development expenditures per sector 1)2)
in millions of euros
2006 2007 2008
Healthcare 572 592 642
Consumer Lifestyle 553 492 407
Lighting 269 276 305
I&EB 265 269 268
Philips Group 1,659 1,629 1,622
Includes the write-off of acquired in-process research and development
1)
of EUR 15 million in 2008 (2007: EUR 13 million, 2006: EUR 33 million)
Total R&D expenditures include costs related to external contract
2)
research, accounting for 3%, 5% and 3% of the Company’s R&D
expenditures for the years 2006, 2007 and 2008, respectively.
Philips Annual Report 200852
42
Our group performance
Management discussion
and analysis
18
We care about...
8
Message from
the President
6
Performance highlights
14
Who we are