Philips 2008 Annual Report Download - page 268
Download and view the complete annual report
Please find page 268 of the 2008 Philips annual report below. You can navigate through the pages in the report by either clicking on the pages listed below, or by using the keyword search tool below to find specific information within the annual report.-
 1
1 -
2
-
3
-
4
-
5
-
6
-
7
-
8
-
9
-
10
-
11
-
12
-
13
-
14
-
15
-
16
-
17
-
18
-
19
-
20
-
21
-
22
-
23
-
24
-
25
-
26
-
27
-
28
-
29
-
30
-
31
-
32
-
33
-
34
-
35
-
36
-
37
-
38
-
39
-
40
-
41
-
42
-
43
-
44
-
45
-
46
-
47
-
48
-
49
-
50
-
51
-
52
-
53
-
54
-
55
-
56
-
57
-
58
-
59
-
60
-
61
-
62
-
63
-
64
-
65
-
66
-
67
-
68
-
69
-
70
-
71
-
72
-
73
-
74
-
75
-
76
-
77
-
78
-
79
-
80
-
81
-
82
-
83
-
84
-
85
-
86
-
87
-
88
-
89
-
90
-
91
-
92
-
93
-
94
-
95
-
96
-
97
-
98
-
99
-
100
-
101
-
102
-
103
-
104
-
105
-
106
-
107
-
108
-
109
-
110
-
111
-
112
-
113
-
114
-
115
-
116
-
117
-
118
-
119
-
120
-
121
-
122
-
123
-
124
-
125
-
126
-
127
-
128
-
129
-
130
-
131
-
132
-
133
-
134
-
135
-
136
-
137
-
138
-
139
-
140
-
141
-
142
-
143
-
144
-
145
-
146
-
147
-
148
-
149
-
150
-
151
-
152
-
153
-
154
-
155
-
156
-
157
-
158
-
159
-
160
-
161
-
162
-
163
-
164
-
165
-
166
-
167
-
168
-
169
-
170
-
171
-
172
-
173
-
174
-
175
-
176
-
177
-
178
-
179
-
180
-
181
-
182
-
183
-
184
-
185
-
186
-
187
-
188
-
189
-
190
-
191
-
192
-
193
-
194
-
195
-
196
-
197
-
198
-
199
-
200
-
201
-
202
-
203
-
204
-
205
-
206
-
207
-
208
-
209
-
210
-
211
-
212
-
213
-
214
-
215
-
216
-
217
-
218
-
219
-
220
-
221
-
222
-
223
-
224
-
225
-
226
-
227
-
228
-
229
-
230
-
231
-
232
-
233
-
234
-
235
-
236
-
237
-
238
-
239
-
240
-
241
-
242
-
243
-
244
-
245
-
246
-
247
-
248
-
249
-
250
-
251
-
252
-
253
-
254
-
255
-
256
-
257
-
 258
258 -
 259
259 -
 260
260 -
 261
261 -
 262
262 -
 263
263 -
 264
264 -
 265
265 -
 266
266 -
 267
267 -
 268
268 -
 269
269 -
 270
270 -
 271
271 -
 272
272 -
 273
273 -
 274
274 -
 275
275 -
 276
276
 |
 |

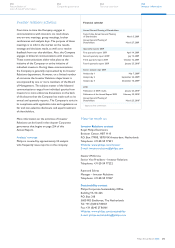
ex-dividend date record date payment date
Amsterdam
shares March 30, 2009 April 1, 2009 April 7, 2009
New York
shares March 30, 2009 April 1, 2009 April 7, 2009
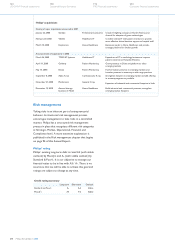
Dividend policy
Our aim is to sustainably grow our dividend over time.
Philips’ present dividend policy is based on an annual
pay-out ratio of 40 to 50% of continuing net income.
Continuing net income, or net income excluding
material non-recurring items and discontinued
operations, is the base figure used to calculate the
dividend payout for the year. For 2008, the key
exclusions used to arrive at continuing net income
include the gains on the sale of shares in LG Display
and TSMC, non-cash value decreases in our remaining
financial stakes, restructuring and the impact of
settlement charges.
Proposed distribution
Consistent with its policy to sustainably grow its
dividend, Philips will submit a proposal to the 2009
General Meeting of Shareholders to declare a distribution
in cash of EUR 0.70 per common share. Philips’ shares
will be traded ex-dividend as of March 30, 2009.
In compliance with the listing requirements of the
New York Stock Exchange and the stock market of
Euronext Amsterdam, the record date will be April 1,
2009. The distribution as proposed to the 2009
General Meeting of Shareholders will be payable as
of April 7, 2009, to all shareholders. The distribution
to holders of New York registry shares will be made
in USD at the USD/EUR rate fixed by the European
Central Bank on April 2, 2009. The dividend paid over
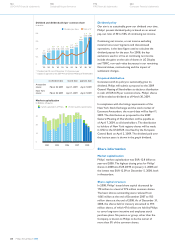
the last ten years is shown in the graph dividend.
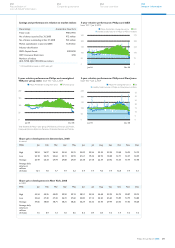
Share information
Market capitalization
Philips’ market capitalization was EUR 12.8 billion at
year-end 2008. The highest closing price for Philips’
shares in 2008 was EUR 28.94 on January 2, 2008 and
the lowest was EUR 12.09 on December 5, 2008, both
in Amsterdam.
Share capital structure
In 2008, Philips’ issued share capital decreased by
170 million to a level of 972 million common shares.
The basic shares outstanding were reduced from
1,065 million at the end of December 2007 to 923
million shares at the end of 2008. As of December 31,
2008, the shares held in treasury amounted to 49.4
million shares, of which 47.6 million are held by Philips
to cover long-term incentive and employee stock
purchase plans. No person or group, other than the
Company, is known to Philips to be the owner of
more than 5% of the common shares.
Market capitalization
in billions of euros
2004 2005 2006 2007 2008
0
10
20
30
of which publicly quoted stakesmarket capitalization of Philips
Dividend and dividend yield per common share
in euros
0.8
0.6
0.4
0.2
0
’99 ’00 ’01 ’02 ’03 ’04 ’05 ’06 ’07 ’08 ’092)
Dividend per share Yield in %1)
0.44
1.7
0.60
2.1 0.70
2.4
0.70
5.1
0.40
2.1
0.25
1.7 0.30
0.9 0.36
0.9
0.36
1.1
0.36
2.2
0.36
1.6
Dividend yield % is as of December 31 of previous year
1)
Subject to approval by the 2009
2) Annual General Meeting of Shareholders
Philips Annual Report 2008268
180
Sustainability performance
192
IFRS financial statements
244
Company financial statements
124
US GAAP financial statements