Philips 2008 Annual Report Download - page 193
Download and view the complete annual report
Please find page 193 of the 2008 Philips annual report below. You can navigate through the pages in the report by either clicking on the pages listed below, or by using the keyword search tool below to find specific information within the annual report.-
 1
1 -
2
-
3
-
4
-
5
-
6
-
7
-
8
-
9
-
10
-
11
-
12
-
13
-
14
-
15
-
16
-
17
-
18
-
19
-
20
-
21
-
22
-
23
-
24
-
25
-
26
-
27
-
28
-
29
-
30
-
31
-
32
-
33
-
34
-
35
-
36
-
37
-
38
-
39
-
40
-
41
-
42
-
43
-
44
-
45
-
46
-
47
-
48
-
49
-
50
-
51
-
52
-
53
-
54
-
55
-
56
-
57
-
58
-
59
-
60
-
61
-
62
-
63
-
64
-
65
-
66
-
67
-
68
-
69
-
70
-
71
-
72
-
73
-
74
-
75
-
76
-
77
-
78
-
79
-
80
-
81
-
82
-
83
-
84
-
85
-
86
-
87
-
88
-
89
-
90
-
91
-
92
-
93
-
94
-
95
-
96
-
97
-
98
-
99
-
100
-
101
-
102
-
103
-
104
-
105
-
106
-
107
-
108
-
109
-
110
-
111
-
112
-
113
-
114
-
115
-
116
-
117
-
118
-
119
-
120
-
121
-
122
-
123
-
124
-
125
-
126
-
127
-
128
-
129
-
130
-
131
-
132
-
133
-
134
-
135
-
136
-
137
-
138
-
139
-
140
-
141
-
142
-
143
-
144
-
145
-
146
-
147
-
148
-
149
-
150
-
151
-
152
-
153
-
154
-
155
-
156
-
157
-
158
-
159
-
160
-
161
-
162
-
163
-
164
-
165
-
166
-
167
-
168
-
169
-
170
-
171
-
172
-
173
-
174
-
175
-
176
-
177
-
178
-
179
-
180
-
181
-
182
-
 183
183 -
 184
184 -
 185
185 -
 186
186 -
 187
187 -
 188
188 -
 189
189 -
 190
190 -
 191
191 -
 192
192 -
 193
193 -
 194
194 -
 195
195 -
 196
196 -
 197
197 -
 198
198 -
 199
199 -
 200
200 -
 201
201 -
 202
202 -
 203
203 -
204
-
205
-
206
-
207
-
208
-
209
-
210
-
211
-
212
-
213
-
214
-
215
-
216
-
217
-
218
-
219
-
220
-
221
-
222
-
223
-
224
-
225
-
226
-
227
-
228
-
229
-
230
-
231
-
232
-
233
-
234
-
235
-
236
-
237
-
238
-
239
-
240
-
241
-
242
-
243
-
244
-
245
-
246
-
247
-
248
-
249
-
250
-
251
-
252
-
253
-
254
-
255
-
256
-
257
-
258
-
259
-
260
-
261
-
262
-
263
-
264
-
265
-
266
-
267
-
268
-
269
-
270
-
271
-
272
-
273
-
274
-
275
-
276
 |
 |

IFRS management commentary
The year 2008...
2008 was impacted by the most globally significant economic
•
downturn in many years. For Philips, this led to a 3% decline in
comparable sales and lower earnings. In response, we proactively
expanded and accelerated restructuring programs across all sectors
and stepped up our focus on costs and cash management.
2008 was nevertheless a year of strategic progress. We continued
•
the reshaping of our portfolio by investing EUR 5.3 billion in
high-
growth, high-margin businesses such as Respironics and Genlyte,
and
divesting unprofitable activities such as Television in North America
and non-core businesses such as Set-Top Boxes and PC Monitors.
Healthcare sales grew by 6% on a comparable basis; all businesses
•
contributed to this growth. Lighting achieved 3% comparable sales
growth, driven by energy-efficient lighting solutions. Consumer
Lifestyle sales declined 8% compared to 2007, reflecting the severe
economic downturn in consumer markets in the second half of 2008.
Emerging markets remained a major focal point and delivered 4% •
comparable growth in 2008 – with Healthcare and Lighting growing
by 12% and 8% respectively. Additionally, we announced and/or
finalized five strategic Healthcare acquisitions in China, Brazil and India.
EBIT included EUR 1.2 billion of charges related to restructuring •
and change programs across all sectors (EUR 535 million), an
asbestos-related settlement charge (EUR 264 million), a non-cash
goodwill impairment charge for Lumileds (EUR 299 million) and
acquisition-related charges, mainly in Healthcare and Lighting
(EUR 131 million), which were partially offset by EUR 147 million
of gains on the sale of businesses and real estate.
We generated strong cash flows from operations of EUR 1,648
•
million despite lower earnings, driven by rigorous working capital
management. In addition, in March we structurally refinanced our
debt – prior to the collapse of the financial markets – providing
Philips with a strong balance sheet and a solid liquidity position
to help weather the turbulent economic situation.
We reduced our shareholding in LG Display and sold our remaining
•
stake in TSMC, generating EUR 2.5 billion in cash proceeds and
realizing a gain of just under EUR 1.4 billion. The economic downturn
led us to take a non-cash value adjustment of EUR 1.3 billion on
the majority of our remaining financial holdings.
We completed EUR 3.3 billion of the EUR 5 billion share buy-back
•
program announced in 2007. Additionally, we returned EUR 720
million to shareholders in the form of a dividend payment.
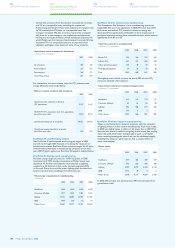
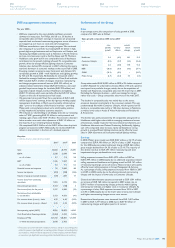
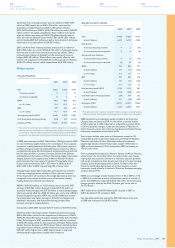
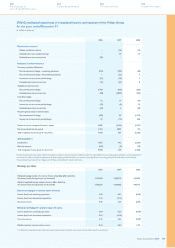
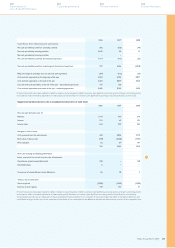
Key data
in millions of euros unless otherwise stated
20061) 20071) 2008
Sales 26,682 26,793 26,385
EBITA 1,528 2,094 744
as a % of sales 5.7 7.8 2.8
EBIT 1,336 1,867 54
as a % of sales 5.0 7.0 0.2
Financial income and expenses 29 2,849 88
Income tax expense (223) (582) (256)
Results of equity-accounted investees (139) 884 19
Income (loss) from continuing
operations 1,003 5,018 (95)
Discontinued operations 4,154 (138) 3
Net income (loss) for the period 5,157 4,880 (92)
Net income (loss) attributable
to stockholders 5,153 4,873 (91)
Per common share (in euro) - basic 4.39 4.49 (0.09)
Per common share (in euro) - diluted 4.35 4.43 (0.09)
Net operating capital (NOC) 8,956 10,802 14,069
Cash flows before financing activities (2,462) 5,452 (1,606)
Employees (FTEs) 121,732 123,801 121,398
of which discontinued operations 6,640 5,703 −
1)
Prior-period amounts have been restated to reflect a change in accounting policy
related to pensions (see Significant accounting policies, Change in
accounting policy)
and revised to reflect immaterial adjustments of intercompany
profit elimination
on inventory (see Significant accounting policies, Reclassifications
and revisions)
Performance of the Group
Sales
In percentage terms, the composition of sales growth in 2008,
compared to 2007, was as follows:
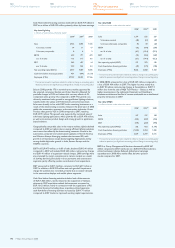
Sales growth composition 2008 versus 2007
in %
com-
parable
growth
currency
effects
consoli-
dation
changes
nominal
growth
Healthcare 5.6 (4.5) 14.1 15.2
Consumer Lifestyle (8.5) (2.7) (5.2) (16.4)
Lighting 2.6 (3.8) 17.8 16.6
I&EB (26.6) (0.9) (9.6) (37.1)
GM&S (24.2) (0.5) −(24.7)
Philips Group (2.7) (3.3) 4.5 (1.5)
Group sales totaled EUR 26,385 million in 2008, a 2% decline compared
to 2007. Adjusted for unfavorable currency effects of 3% and a positive
net impact from portfolio changes, mainly due to the acquisition of
Genlyte and Respironics, comparable sales were 3% lower than in 2007.
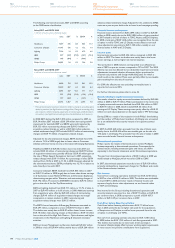
Excluding the Television business – which we manage for margin
rather than scale – Group comparable sales were in line with 2007.
The decline in comparable sales was mainly due to the severe
economic downturn, particularly in the consumer markets. This was
predominantly felt within Consumer Lifestyle, which reported an 8%
decline in comparable sales, led by a 12% sales decrease at Television,
as well as lower sales in Audio & Video Multimedia and Peripherals
& Accessories.
This decline was partly tempered by 6% comparable sales growth at
Healthcare, with higher sales visible in emerging markets and across
all businesses, notably Customer Services, Clinical Care Systems, and
Healthcare Informatics and Patient Monitoring. Additionally, Lighting
saw a 3% comparable sales increase, mainly attributable to strong
growth in energy-efficient lighting solutions, partly offset by lower
sales in OEM automotive and consumer-related lighting markets.
Earnings
In 2008, Philips’ gross margin was EUR 8,467 million, or 32.1% of sales,
compared to EUR 9,190 million, or 34.3% of sales, in 2007. Adjusted
for the 2008 asbestos-related settlement charge of EUR 264 million,
gross margin declined from 34.3% of sales to 33.1%. The majority of
this decline was due to EUR 297 million restructuring and asset
impairment charges, attributable to most sectors.
Selling expenses increased from EUR 4,975 million in 2007 to
EUR 5,499 million in 2008, largely due to additional acquisition-related
selling expenses at Healthcare and Lighting, as well as EUR 147 million
of restructuring charges across all sectors. These increases were partly
offset by lower selling expenses at Group Management & Services.
As a percentage of sales, selling expenses increased from 18.6% in 2007
to 20.8% in 2008, mainly due to the aforementioned restructuring
charges and the impact of lower sales at Consumer Lifestyle.
General and administrative expenses amounted to EUR 1,011 million,
an increase of EUR 160 million compared to 2007, mainly due to
EUR 51 million of restructuring charges, primarily within Lighting
and Consumer Lifestyle, and higher costs in Consumer Lifestyle. As
a percentage of sales, G&A expenses increased from 3.2% in 2007
to 3.8% in 2008, largely due to the lower sales in Consumer Lifestyle
and higher restructuring charges across most sectors.
Research and development costs increased from EUR 1,601 million
in 2007 to EUR 1,777 million in 2008 due to EUR 40 million of
restructuring charges and higher spend in all sectors.
Philips Annual Report 2008 193
254
Corporate governance
250
Reconciliation of
non-US GAAP information
262
Ten-year overview
266
Investor information