Philips 2008 Annual Report Download - page 177
Download and view the complete annual report
Please find page 177 of the 2008 Philips annual report below. You can navigate through the pages in the report by either clicking on the pages listed below, or by using the keyword search tool below to find specific information within the annual report.-
 1
1 -
2
-
3
-
4
-
5
-
6
-
7
-
8
-
9
-
10
-
11
-
12
-
13
-
14
-
15
-
16
-
17
-
18
-
19
-
20
-
21
-
22
-
23
-
24
-
25
-
26
-
27
-
28
-
29
-
30
-
31
-
32
-
33
-
34
-
35
-
36
-
37
-
38
-
39
-
40
-
41
-
42
-
43
-
44
-
45
-
46
-
47
-
48
-
49
-
50
-
51
-
52
-
53
-
54
-
55
-
56
-
57
-
58
-
59
-
60
-
61
-
62
-
63
-
64
-
65
-
66
-
67
-
68
-
69
-
70
-
71
-
72
-
73
-
74
-
75
-
76
-
77
-
78
-
79
-
80
-
81
-
82
-
83
-
84
-
85
-
86
-
87
-
88
-
89
-
90
-
91
-
92
-
93
-
94
-
95
-
96
-
97
-
98
-
99
-
100
-
101
-
102
-
103
-
104
-
105
-
106
-
107
-
108
-
109
-
110
-
111
-
112
-
113
-
114
-
115
-
116
-
117
-
118
-
119
-
120
-
121
-
122
-
123
-
124
-
125
-
126
-
127
-
128
-
129
-
130
-
131
-
132
-
133
-
134
-
135
-
136
-
137
-
138
-
139
-
140
-
141
-
142
-
143
-
144
-
145
-
146
-
147
-
148
-
149
-
150
-
151
-
152
-
153
-
154
-
155
-
156
-
157
-
158
-
159
-
160
-
161
-
162
-
163
-
164
-
165
-
166
-
 167
167 -
 168
168 -
 169
169 -
 170
170 -
 171
171 -
 172
172 -
 173
173 -
 174
174 -
 175
175 -
 176
176 -
 177
177 -
 178
178 -
 179
179 -
 180
180 -
 181
181 -
 182
182 -
 183
183 -
 184
184 -
 185
185 -
 186
186 -
 187
187 -
188
-
189
-
190
-
191
-
192
-
193
-
194
-
195
-
196
-
197
-
198
-
199
-
200
-
201
-
202
-
203
-
204
-
205
-
206
-
207
-
208
-
209
-
210
-
211
-
212
-
213
-
214
-
215
-
216
-
217
-
218
-
219
-
220
-
221
-
222
-
223
-
224
-
225
-
226
-
227
-
228
-
229
-
230
-
231
-
232
-
233
-
234
-
235
-
236
-
237
-
238
-
239
-
240
-
241
-
242
-
243
-
244
-
245
-
246
-
247
-
248
-
249
-
250
-
251
-
252
-
253
-
254
-
255
-
256
-
257
-
258
-
259
-
260
-
261
-
262
-
263
-
264
-
265
-
266
-
267
-
268
-
269
-
270
-
271
-
272
-
273
-
274
-
275
-
276
 |
 |

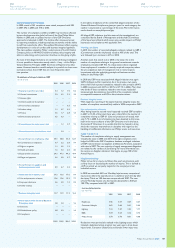
Remuneration of the Supervisory Board
The remuneration of the members of the Supervisory Board
amounted to EUR 851,250 (2007: EUR 540,000, 2006: EUR 494,500);
former members received no remuneration.
At year-end 2008, the present members of the Supervisory Board
held no stock options.
The individual members of the Supervisory Board received, by virtue
of the positions they held, the following remuneration (in euros):
member-
ship
commit-
tees
fee for
inter-
continental
travel1) total
2008
W. de Kleuver
(Jan.-March) 55,000 5,125 −60,125
L. Schweitzer
(Jan.-March) 32,500 1,500 −34,000
J-M. Hessels 98,750 19,125 3,000 120,875
J.M. Thompson 65,000 14,000 9,000 88,000
R. Greenbury 65,000 8,000 3,000 76,000
K.A.L.M. van Miert 65,000 10,000 3,000 78,000
C.J.A. van Lede 65,000 12,500 3,000 80,500
E. Kist 65,000 13,750 3,000 81,750
N.L. Wong 65,000 −9,000 74,000
J.J. Schiro 65,000 14,500 3,000 82,500
H. von Prondzynski 65,000 7,500 3,000 75,500
706,250 106,000 39,000 851,250
2007
W. de Kleuver 75,000 10,500 −85,500
L. Schweitzer 41,000 4,500 −45,500
J-M. Hessels 41,000 7,000 −48,000
J.M. Thompson 41,000 9,000 −50,000
R. Greenbury 41,000 4,500 −45,500
K.A.L.M. van Miert 41,000 4,500 −45,500
C.J.A. van Lede 41,000 6,000 −47,000
E. Kist 41,000 4,500 −45,500
N.L. Wong 41,000 −−41,000
J.J. Schiro 41,000 4,500 −45,500
H. von Prondzynski
(Apr.-Dec.) 41,000 −−41,000
485,000 55,000 −540,000
2006
W. de Kleuver 75,000 10,500 −85,500
L. Schweitzer 41,000 4,500 −45,500
J-M. Hessels 41,000 7,000 −48,000
J.M. Thompson 41,000 4,500 −45,500
R. Greenbury 41,000 4,500 −45,500
K.A.L.M. van Miert 41,000 4,500 −45,500
C.J.A. van Lede 41,000 6,000 −47,000
E. Kist 41,000 4,500 −45,500
N.L. Wong 41,000 −−41,000
J.J. Schiro 41,000 4,500 −45,500
444,000 50,500 −494,500
The fee for intercontinental travel was approved by the General Meeting
1)
of Shareholders in 2008
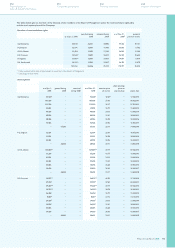
Supervisory Board members’ and Board of Management
members’ interests in Philips shares
Members of the Supervisory Board and of the Board of Management
are not allowed to hold any interests in derivative Philips securities.
Number of shares 1)
as of December
31, 2007
as of December
31, 2008
H. von Prondzynski 430 2,930
J.M. Thompson 1,000 1,000
G.J. Kleisterlee 151,916 173,039
P-J. Sivignon 10,779 22,769
G.H.A. Dutiné 33,633 46,418
R.S. Provoost 30,198 41,495
A. Ragnetti 20,729 31,597
S.H. Rusckowski 26,584 40,125
Reference date for board membership is December 31, 2008
1)
35
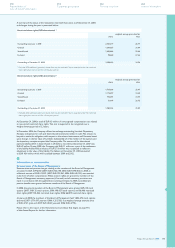
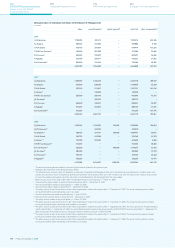
Fair value of financial assets and liabilities
The estimated fair value of financial instruments has been determined
by the Company using available market information and appropriate
valuation methods. The estimates presented are not necessarily
indicative of the amounts that will ultimately be realized by the Company
upon maturity or disposal.
The table below presents our assets and liabilities measured at
December 31, 2008, at estimated fair value on a recurring basis as
required by SFAS No. 157. Comparative numbers are presented in
line with SFAS No. 107, ‘Disclosure about Fair Value Instruments’.
SFAS No. 107 requires disclosure of estimated fair value of certain
financial instruments and the methods and significant assumptions
used to estimate their fair values. Because of the variety of valuation
techniques permitted under SFAS No. 107 comparisons of fair values
between entities may not be meaningful. The use of different market
assumptions and/or estimation
methods may have a material effect on
the estimated fair value amounts.
December 31, 2007 December 31, 2008
carrying
amount
estimated
fair value
carrying
amount
estimated
fair value
Level 1
Assets
Other non-current
financial assets excl.
cost-method investments 1,965 1,965 786 786
Level 2
Assets
Derivative instruments
Other non-current
financial assets
275
191
275
191
253
194
253
194
Liabilities
Derivative instruments (144) (144) (505) (505)
322 322 (58) (58)
Certain assets are measured at fair value on a non-recurring basis,
and therefore not included in the preceding tables. The fair value
identified as Level 2 of the fair value hierarchy is EUR 32 million
relating to TPO Display as discussed in note 12. The fair value
identified as Level 3 of the fair value hierarchy is EUR 255 million
relating to NXP as discussed in note 12.
35
Philips Annual Report 2008 177
254
Corporate governance
250
Reconciliation of
non-US GAAP information
262
Ten-year overview
266
Investor information