Philips 2008 Annual Report Download - page 196
Download and view the complete annual report
Please find page 196 of the 2008 Philips annual report below. You can navigate through the pages in the report by either clicking on the pages listed below, or by using the keyword search tool below to find specific information within the annual report.-
 1
1 -
2
-
3
-
4
-
5
-
6
-
7
-
8
-
9
-
10
-
11
-
12
-
13
-
14
-
15
-
16
-
17
-
18
-
19
-
20
-
21
-
22
-
23
-
24
-
25
-
26
-
27
-
28
-
29
-
30
-
31
-
32
-
33
-
34
-
35
-
36
-
37
-
38
-
39
-
40
-
41
-
42
-
43
-
44
-
45
-
46
-
47
-
48
-
49
-
50
-
51
-
52
-
53
-
54
-
55
-
56
-
57
-
58
-
59
-
60
-
61
-
62
-
63
-
64
-
65
-
66
-
67
-
68
-
69
-
70
-
71
-
72
-
73
-
74
-
75
-
76
-
77
-
78
-
79
-
80
-
81
-
82
-
83
-
84
-
85
-
86
-
87
-
88
-
89
-
90
-
91
-
92
-
93
-
94
-
95
-
96
-
97
-
98
-
99
-
100
-
101
-
102
-
103
-
104
-
105
-
106
-
107
-
108
-
109
-
110
-
111
-
112
-
113
-
114
-
115
-
116
-
117
-
118
-
119
-
120
-
121
-
122
-
123
-
124
-
125
-
126
-
127
-
128
-
129
-
130
-
131
-
132
-
133
-
134
-
135
-
136
-
137
-
138
-
139
-
140
-
141
-
142
-
143
-
144
-
145
-
146
-
147
-
148
-
149
-
150
-
151
-
152
-
153
-
154
-
155
-
156
-
157
-
158
-
159
-
160
-
161
-
162
-
163
-
164
-
165
-
166
-
167
-
168
-
169
-
170
-
171
-
172
-
173
-
174
-
175
-
176
-
177
-
178
-
179
-
180
-
181
-
182
-
183
-
184
-
185
-
 186
186 -
 187
187 -
 188
188 -
 189
189 -
 190
190 -
 191
191 -
 192
192 -
 193
193 -
 194
194 -
 195
195 -
 196
196 -
 197
197 -
 198
198 -
 199
199 -
 200
200 -
 201
201 -
 202
202 -
 203
203 -
 204
204 -
 205
205 -
 206
206 -
207
-
208
-
209
-
210
-
211
-
212
-
213
-
214
-
215
-
216
-
217
-
218
-
219
-
220
-
221
-
222
-
223
-
224
-
225
-
226
-
227
-
228
-
229
-
230
-
231
-
232
-
233
-
234
-
235
-
236
-
237
-
238
-
239
-
240
-
241
-
242
-
243
-
244
-
245
-
246
-
247
-
248
-
249
-
250
-
251
-
252
-
253
-
254
-
255
-
256
-
257
-
258
-
259
-
260
-
261
-
262
-
263
-
264
-
265
-
266
-
267
-
268
-
269
-
270
-
271
-
272
-
273
-
274
-
275
-
276
 |
 |

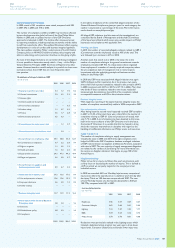
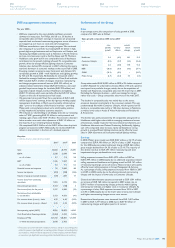
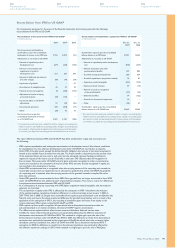
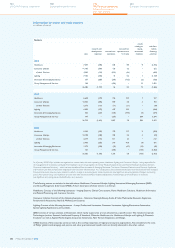
Cash flows before financing activities declined from EUR 754 million in
2007 to an inflow of EUR 252 million, primarily driven by lower earnings.
Key data Lighting
in millions of euros unless otherwise stated
20061) 20071) 2008
Sales 5,466 6,093 7,106
% increase, nominal 14 11 17
% increase, comparable 8 6 3
EBITA 620 711 470
as a % of sales 11.3 11.7 6.6
EBIT 549 637 14
as a % of sales 10.0 10.5 0.2
Net operating capital (NOC) 2,817 4,059 5,685
Cash flows before financing activities 451 (644) (1,137)
Employees (FTEs) 47,739 54,323 57,166
1)
Prior-period amounts have been restated to reflect a change in accounting policy
related to pensions (see Significant accounting policies, Change in
accounting policy)
Sales in 2008 grew by 17% in nominal terms, mainly supported by
the acquired companies: Genlyte and Color Kinetics. Adjusted for
portfolio changes of 18% and unfavorable currency effects of 4%,
comparable sales grew by 3% compared to 2007. This growth was
driven by continued sales growth in energy-efficient lighting solutions,
notably within the Lamps and Professional Luminaires businesses.
Sales were broadly in line with 2007 in the remaining businesses as a
result of the deteriorating economic climate in the latter part of 2008
within the automotive, consumer and construction industries. Green
Product sales grew by 12% in 2008 compared to 2007, reaching
EUR 2,970 million. This growth was supported by increased sales of
solid-state lighting applications, which grew by 6% to EUR 470 million,
as well as innovative product design and strong growth in application-
based solutions.
Geographically, comparable sales in the mature markets slightly declined
compared to 2007, as higher sales in energy-efficient lighting solutions
were more than offset by the deteriorating economic climate in the
automotive, consumer and construction segments in North America
and Western Europe. Emerging market sales increased 8%, with
growth in all businesses except Special Lighting Applications, led by
strong double-digit sales growth in India, Eastern Europe and the
ASEAN countries.
EBITA of EUR 470 million, or 6.6% of sales, declined EUR 241 million
compared to 2007 and included EUR 245 million restructuring charges
and EUR 41 million of acquisition-related charges. 2008 earnings were
also impacted by margin compression in mature markets as a result
of slowing demand, particularly in the automotive and construction
segments, partly offset by positive contributions from acquisitions.
EBIT amounted to EUR 14 million, compared to EUR 637 million in
2007. In addition, a EUR 299 million non-cash goodwill impairment
charge for Lumileds was recorded, primarily due to weaker demand
in the automotive, displays and mobile phone segments.
Cash flow before financing activities included cash disbursements
of EUR 1,826 million, mainly related to the acquisition of Genlyte,
whereas in 2007 acquisition-related disbursements amounted to
EUR 1,162 million, mainly in connection with the acquisitions of PLI
and Color Kinetics. Excluding these acquisition-related payments,
cash flow before financing activities increased by EUR 171 million
compared to 2007 thanks to improved working capital requirements.
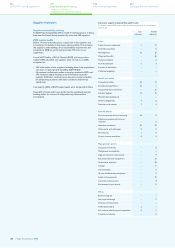
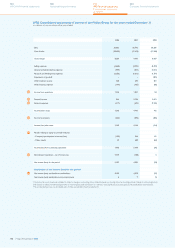
Key data I&EB
in millions of euros unless otherwise stated
20061) 20071) 2008
Sales 1,379 535 337
% decrease, nominal (28) (61) (37)
% increase (decrease), comparable (9) 38 (27)
EBITA (92) (104) (247)
as a % of sales (6.7) (19.4) (73.3)
EBIT (93) (104) (247)
as a % of sales (6.7) (19.4) (73.3)
Net operating capital (NOC) 171 270 150
Cash flows before financing activities (49) (179) (128)
Employees (FTEs) 8,832 5,888 5,324
1)
Prior-period amounts have been restated to reflect a change in accounting policy
related to pensions (see Significant accounting policies, Change in
accounting policy)
In 2008, EBITA amounted to a loss of EUR 247 million, compared to
a loss of EUR 104 million in 2007. The higher loss was mainly due
to EUR 18 million restructuring charges at Assembléon, a EUR 13
million loss from the sale of High Tech Plastics – Optics, as well as
higher investments in the Lighting & Cleantech and Healthcare
Incubator activities and decline in income attributable to an intellectual
property transaction in 2007.
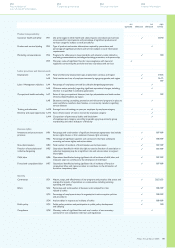
Key data GM&S
in millions of euros unless otherwise stated
20061) 20071) 2008
Sales 167 197 148
EBITA (595) (227) (494)
EBIT (595) (227) (494)
Net operating capital (NOC) 202 602 (1,376)
Cash flows before financing activities (1,832) 5,294 1,822
Employees (FTEs) 6,879 5,299 6,011
1)
Prior-period amounts have been restated to reflect a change in accounting policy
related to pensions (see Significant accounting policies, Change in
accounting policy)
EBITA at Group Management & Services decreased by EUR 267
million compared to 2007, mainly due to a EUR 264 million asbestos-
related settlement charge. Reduced global brand campaign
expenditures in 2008 were mainly offset by lower pension
results compared to 2007.
Philips Annual Report 2008196
180
Sustainability performance
244
Company financial statements
124
US GAAP financial statements
192
IFRS financial statements
IFRS management commentary