Philips 2008 Annual Report Download - page 262
Download and view the complete annual report
Please find page 262 of the 2008 Philips annual report below. You can navigate through the pages in the report by either clicking on the pages listed below, or by using the keyword search tool below to find specific information within the annual report.-
 1
1 -
2
-
3
-
4
-
5
-
6
-
7
-
8
-
9
-
10
-
11
-
12
-
13
-
14
-
15
-
16
-
17
-
18
-
19
-
20
-
21
-
22
-
23
-
24
-
25
-
26
-
27
-
28
-
29
-
30
-
31
-
32
-
33
-
34
-
35
-
36
-
37
-
38
-
39
-
40
-
41
-
42
-
43
-
44
-
45
-
46
-
47
-
48
-
49
-
50
-
51
-
52
-
53
-
54
-
55
-
56
-
57
-
58
-
59
-
60
-
61
-
62
-
63
-
64
-
65
-
66
-
67
-
68
-
69
-
70
-
71
-
72
-
73
-
74
-
75
-
76
-
77
-
78
-
79
-
80
-
81
-
82
-
83
-
84
-
85
-
86
-
87
-
88
-
89
-
90
-
91
-
92
-
93
-
94
-
95
-
96
-
97
-
98
-
99
-
100
-
101
-
102
-
103
-
104
-
105
-
106
-
107
-
108
-
109
-
110
-
111
-
112
-
113
-
114
-
115
-
116
-
117
-
118
-
119
-
120
-
121
-
122
-
123
-
124
-
125
-
126
-
127
-
128
-
129
-
130
-
131
-
132
-
133
-
134
-
135
-
136
-
137
-
138
-
139
-
140
-
141
-
142
-
143
-
144
-
145
-
146
-
147
-
148
-
149
-
150
-
151
-
152
-
153
-
154
-
155
-
156
-
157
-
158
-
159
-
160
-
161
-
162
-
163
-
164
-
165
-
166
-
167
-
168
-
169
-
170
-
171
-
172
-
173
-
174
-
175
-
176
-
177
-
178
-
179
-
180
-
181
-
182
-
183
-
184
-
185
-
186
-
187
-
188
-
189
-
190
-
191
-
192
-
193
-
194
-
195
-
196
-
197
-
198
-
199
-
200
-
201
-
202
-
203
-
204
-
205
-
206
-
207
-
208
-
209
-
210
-
211
-
212
-
213
-
214
-
215
-
216
-
217
-
218
-
219
-
220
-
221
-
222
-
223
-
224
-
225
-
226
-
227
-
228
-
229
-
230
-
231
-
232
-
233
-
234
-
235
-
236
-
237
-
238
-
239
-
240
-
241
-
242
-
243
-
244
-
245
-
246
-
247
-
248
-
249
-
250
-
251
-
 252
252 -
 253
253 -
 254
254 -
 255
255 -
 256
256 -
 257
257 -
 258
258 -
 259
259 -
 260
260 -
 261
261 -
 262
262 -
 263
263 -
 264
264 -
 265
265 -
 266
266 -
 267
267 -
 268
268 -
 269
269 -
 270
270 -
 271
271 -
 272
272 -
273
-
274
-
275
-
276
 |
 |

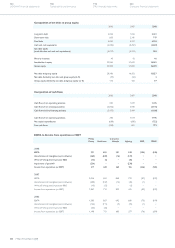
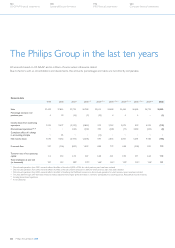
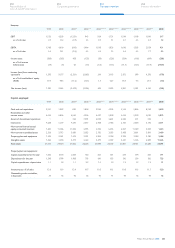
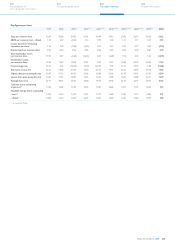
The Philips Group in the last ten years
General data
1999 2000 20011) 20021) 2) 20031) 2) 3) 2004
1) 2) 3) 4) 20051) 2) 3) 4) 20061) 2) 3) 4) 20073) 4) 2008
Sales 31,459 37,862 31,725 26,788 23,614 24,488 25,445 26,682 26,793 26,385
Percentage increase over
previous year 3 20 (16) (2) (10) 4 4 5 −(2)
Income (loss) from continuing
operations 1,595 9,577 (2,331) (2,863) 219 3,163 2,872 899 4,593 (178)
Discontinued operations1) 2) 3) −−(144) (343) 490 (328) (11) 4,482 (433) (8)
Cumulative effect of a change
in accounting principle
−85 −−(14) −−−−−
Net income (loss) 1,590 9,662 (2,475) (3,206) 695 2,835 2,861 5,381 4,160 (186)
Free cash flow 337 (136) (801) 1,093 848 779 648 (358) 821 773
Turnover rate of net operating
capital 3.2 3.12 2.15 3.07 4.48 5.31 4.95 3.11 2.64 1.72
Total employees at year-end
(in thousands) 227 219 1895) 1705) 1645) 1625) 1595) 1225) 1245) 121
Discontinued operations from 2001 onwards reflects the effect of the sale of MDS in 2006, for which previous years have been restated
1)
Discontinued operations from 2002 onwards reflects the effect of the sale of Semiconductors in 2006, for which previous years have been restated
2)
Discontinued operations from 2003 onwards reflects the effect of classifying the MedQuist business as a discontinued operation, for which previous years have been restated
3)
The years 2004 through 2007 have been revised to reflect adjusted intercompany profit elimination in inventory (see Significant accounting policies, Reclassifications and revisions)
4)
Including discontinued operations
5)
In manufacturing
6)
All amounts based on US GAAP and in millions of euros unless otherwise stated.
Due to factors such as consolidations and divestments, the amounts, percentages and ratios are not directly comparable.
Philips Annual Report 2008262
180
Sustainability performance
192
IFRS financial statements
244
Company financial statements
124
US GAAP financial statements