Philips 2008 Annual Report Download - page 208
Download and view the complete annual report
Please find page 208 of the 2008 Philips annual report below. You can navigate through the pages in the report by either clicking on the pages listed below, or by using the keyword search tool below to find specific information within the annual report.-
 1
1 -
2
-
3
-
4
-
5
-
6
-
7
-
8
-
9
-
10
-
11
-
12
-
13
-
14
-
15
-
16
-
17
-
18
-
19
-
20
-
21
-
22
-
23
-
24
-
25
-
26
-
27
-
28
-
29
-
30
-
31
-
32
-
33
-
34
-
35
-
36
-
37
-
38
-
39
-
40
-
41
-
42
-
43
-
44
-
45
-
46
-
47
-
48
-
49
-
50
-
51
-
52
-
53
-
54
-
55
-
56
-
57
-
58
-
59
-
60
-
61
-
62
-
63
-
64
-
65
-
66
-
67
-
68
-
69
-
70
-
71
-
72
-
73
-
74
-
75
-
76
-
77
-
78
-
79
-
80
-
81
-
82
-
83
-
84
-
85
-
86
-
87
-
88
-
89
-
90
-
91
-
92
-
93
-
94
-
95
-
96
-
97
-
98
-
99
-
100
-
101
-
102
-
103
-
104
-
105
-
106
-
107
-
108
-
109
-
110
-
111
-
112
-
113
-
114
-
115
-
116
-
117
-
118
-
119
-
120
-
121
-
122
-
123
-
124
-
125
-
126
-
127
-
128
-
129
-
130
-
131
-
132
-
133
-
134
-
135
-
136
-
137
-
138
-
139
-
140
-
141
-
142
-
143
-
144
-
145
-
146
-
147
-
148
-
149
-
150
-
151
-
152
-
153
-
154
-
155
-
156
-
157
-
158
-
159
-
160
-
161
-
162
-
163
-
164
-
165
-
166
-
167
-
168
-
169
-
170
-
171
-
172
-
173
-
174
-
175
-
176
-
177
-
178
-
179
-
180
-
181
-
182
-
183
-
184
-
185
-
186
-
187
-
188
-
189
-
190
-
191
-
192
-
193
-
194
-
195
-
196
-
197
-
 198
198 -
 199
199 -
 200
200 -
 201
201 -
 202
202 -
 203
203 -
 204
204 -
 205
205 -
 206
206 -
 207
207 -
 208
208 -
 209
209 -
 210
210 -
 211
211 -
 212
212 -
 213
213 -
 214
214 -
 215
215 -
 216
216 -
 217
217 -
 218
218 -
219
-
220
-
221
-
222
-
223
-
224
-
225
-
226
-
227
-
228
-
229
-
230
-
231
-
232
-
233
-
234
-
235
-
236
-
237
-
238
-
239
-
240
-
241
-
242
-
243
-
244
-
245
-
246
-
247
-
248
-
249
-
250
-
251
-
252
-
253
-
254
-
255
-
256
-
257
-
258
-
259
-
260
-
261
-
262
-
263
-
264
-
265
-
266
-
267
-
268
-
269
-
270
-
271
-
272
-
273
-
274
-
275
-
276
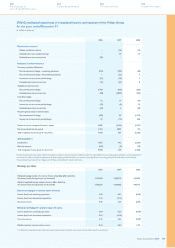
 |
 |

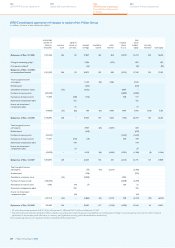
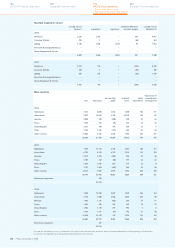
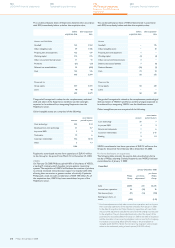
Goodwill assigned to sectors
carrying value at
January 1 acquisitions impairment
translation differences
and other changes
carrying value at
December 31
2008
Healthcare 2,235 2,421 −305 4,961
Consumer Lifestyle 425 5 −(66) 364
Lighting 1,140 1,024 (301) 92 1,955
Innovation & Emerging Businesses −−−−−
Group Management & Services −−−−−
3,800 3,450 (301) 331 7,280
2007
Healthcare 2,361 116 −(242) 2,235
Consumer Lifestyle 460 7 −(42) 425
Lighting 585 637 −(82) 1,140
Innovation & Emerging Businesses −−−−−
Group Management & Services −−−−−
3,406 760 −(366) 3,800
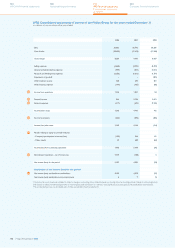
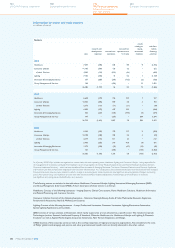
Main countries
sales total assets
net operating
capital
long-lived
assets
capital
expenditures
depreciation of
property, plant
and equipment
2008
Netherlands 1,012 8,858 3,016 1,348 156 151
United States 7,027 14,240 9,152 10,770 192 82
Germany 2,048 978 (308) 298 50 46
France 1,692 534 (77) 137 55 26
United Kingdom 1,016 729 414 524 13 9
China 1,754 1,325 (172) 242 60 44
Other countries 11,836 5,126 2,044 1,934 244 371
26,385 31,790 14,069 15,253 770 729
2007
Netherlands 1,159 14,115 2,155 1,367 163 151
United States 6,725 8,133 6,747 5,159 115 103
Germany 2,014 1,375 (255) 326 50 46
France 1,784 722 (86) 147 23 26
United Kingdom 1,250 1,037 689 719 13 8
China 1,707 1,254 (497) 189 36 42
Other countries 12,154 9,359 2,049 1,922 258 186
26,793 35,995 10,802 9,829 658 562
Discontinued operations 319
36,314
2006
Netherlands 1,088 10,790 3,697 1,299 246 162
United States 7,153 7,888 4,558 5,229 209 98
Germany 1,985 1,196 (405) 340 57 51
France 1,626 632 342 146 18 32
United Kingdom 1,186 1,133 714 790 4 6
China 1,740 1,141 (99) 192 31 42
Other countries 11,904 15,337 149 1,070 133 163
26,682 38,117 8,956 9,066 698 554
Discontinued operations 427
38,544
The sales are attributed by country of destination. Prior-period amounts have been revised to reflect immaterial adjustments of intercompany profit elimination
on inventory (see Significant accounting policies, Reclassifications and revisions).
Philips Annual Report 2008208
180
Sustainability performance
244
Company financial statements
124
US GAAP financial statements
192
IFRS financial statements
- Sector and main country
- Significant IFRS accounting policies