Philips 2008 Annual Report Download - page 234
Download and view the complete annual report
Please find page 234 of the 2008 Philips annual report below. You can navigate through the pages in the report by either clicking on the pages listed below, or by using the keyword search tool below to find specific information within the annual report.-
 1
1 -
2
-
3
-
4
-
5
-
6
-
7
-
8
-
9
-
10
-
11
-
12
-
13
-
14
-
15
-
16
-
17
-
18
-
19
-
20
-
21
-
22
-
23
-
24
-
25
-
26
-
27
-
28
-
29
-
30
-
31
-
32
-
33
-
34
-
35
-
36
-
37
-
38
-
39
-
40
-
41
-
42
-
43
-
44
-
45
-
46
-
47
-
48
-
49
-
50
-
51
-
52
-
53
-
54
-
55
-
56
-
57
-
58
-
59
-
60
-
61
-
62
-
63
-
64
-
65
-
66
-
67
-
68
-
69
-
70
-
71
-
72
-
73
-
74
-
75
-
76
-
77
-
78
-
79
-
80
-
81
-
82
-
83
-
84
-
85
-
86
-
87
-
88
-
89
-
90
-
91
-
92
-
93
-
94
-
95
-
96
-
97
-
98
-
99
-
100
-
101
-
102
-
103
-
104
-
105
-
106
-
107
-
108
-
109
-
110
-
111
-
112
-
113
-
114
-
115
-
116
-
117
-
118
-
119
-
120
-
121
-
122
-
123
-
124
-
125
-
126
-
127
-
128
-
129
-
130
-
131
-
132
-
133
-
134
-
135
-
136
-
137
-
138
-
139
-
140
-
141
-
142
-
143
-
144
-
145
-
146
-
147
-
148
-
149
-
150
-
151
-
152
-
153
-
154
-
155
-
156
-
157
-
158
-
159
-
160
-
161
-
162
-
163
-
164
-
165
-
166
-
167
-
168
-
169
-
170
-
171
-
172
-
173
-
174
-
175
-
176
-
177
-
178
-
179
-
180
-
181
-
182
-
183
-
184
-
185
-
186
-
187
-
188
-
189
-
190
-
191
-
192
-
193
-
194
-
195
-
196
-
197
-
198
-
199
-
200
-
201
-
202
-
203
-
204
-
205
-
206
-
207
-
208
-
209
-
210
-
211
-
212
-
213
-
214
-
215
-
216
-
217
-
218
-
219
-
220
-
221
-
222
-
223
-
 224
224 -
 225
225 -
 226
226 -
 227
227 -
 228
228 -
 229
229 -
 230
230 -
 231
231 -
 232
232 -
 233
233 -
 234
234 -
 235
235 -
 236
236 -
 237
237 -
 238
238 -
 239
239 -
 240
240 -
 241
241 -
 242
242 -
 243
243 -
 244
244 -
245
-
246
-
247
-
248
-
249
-
250
-
251
-
252
-
253
-
254
-
255
-
256
-
257
-
258
-
259
-
260
-
261
-
262
-
263
-
264
-
265
-
266
-
267
-
268
-
269
-
270
-
271
-
272
-
273
-
274
-
275
-
276
 |
 |

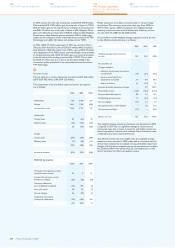
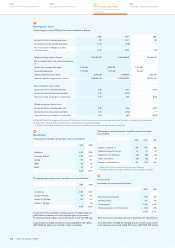
Defined-benefit plans
Employee pension plans have been established in many countries in
accordance with the legal requirements, customs and the local situation
in the countries involved. The majority of employees in Europe and
North America are covered by defined-benefit plans. The benefits
provided by these plans are based on employees’ years of service and
compensation levels. The measurement date for all defined-benefit
plans is December 31.
The Company’s contributions to the funding of defined-benefit
pension plans are determined based upon various factors, including
funded status, legal and tax considerations as well as local customs.
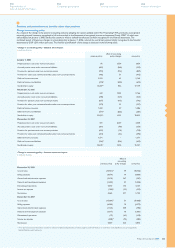
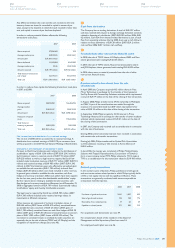
Summary of pre-tax costs for pensions and other post
retirement benefits
2006 2007 2008
Defined-benefit plans (10) (38) (21)
Defined-contribution plans including
multi-employer plans 80 84 96
Retiree medical plans 30 29 31
100 75 106
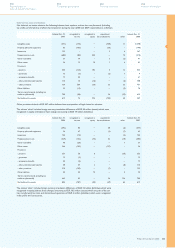
The table below provides a summary of the changes in the projected
benefit obligations for defined-benefit pension plans and the fair value
of their assets for 2008 and 2007. It also provides a reconciliation of
the funded status of these plans to the amounts recognized in the
consolidated balance sheets.
2007 2008
Projected benefit obligation at the beginning of year 20,410 18,679
Service cost 265 219
Interest cost 920 922
Employee contributions 4 4
Actuarial (gains) or losses (756) (1,182)
Plan amendments 4 1
Settlements (502) (22)
Curtailments 2 (1)
Changes in consolidation 49 106
Benefits paid (1,152) (1,190)
Exchange rate differences (564) (688)
Miscellaneous (1) (2)
Projected benefit obligation at end of year 18,679 16,846
Present value of funded obligations at end of year 17,866 16,085
Present value of unfunded obligations at end
of year 813 761
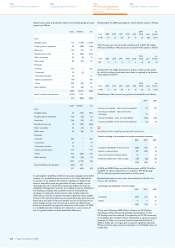
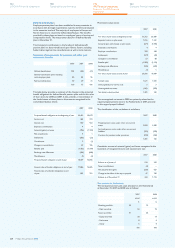
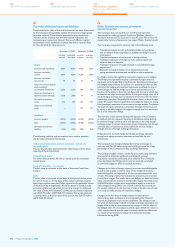
Movement in plan assets:
2007 2008
Fair value of plan assets at beginning of year 21,352 20,200
Expected return on plan assets 1,216 1,161
Actuarial gains and (losses) on plan assets (571) (1,955)
Employee contributions 4 4
Employer contributions 332 184
Settlements (577) (22)
Changes in consolidation 53 88
Benefits paid (1,083) (1,113)
Exchange rate differences (525) (649)
Miscellaneous (1) 1
Fair value of plan assets at end of year 20,200 17,899
Funded status 1,521 1,053
Unrecognized prior-service cost 5 3
Unrecognized net assets (145) (893)
Net balance sheet position 1,381 163
The unrecognized net assets in 2008 are primarily related to the
capped prepaid pension asset in the Netherlands, in 2007 primarily
to the capped prepaid in Brazil.
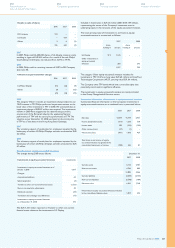
The classification of the net balance is as follows:
2007 2008
Prepaid pension costs under other non-current
assets 2,558 1,858
Accrued pension costs under other non-current
liabilities (359) (932)
Provision for pensions under provisions (818) (763)
1,381 163
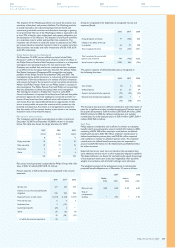
Cumulative amount of actuarial (gains) and losses recognized in the
statement of recognized income and expense (pre tax):
2007 2008
Balance as of January 1 518 343
New consolidations (2) −
Net actuarial loss (gain) (220) 623
Change in the effect of the cap on prepaid 47 748
Balance as of December 31 343 1,714
Plan assets in the Netherlands
The Company’s pension plan asset allocation in the Netherlands
at December 31, 2007 and 2008 was as follows:
2007 2008
actual actual
%%
Matching portfolio: 59 75
- Debt securities 59 75
Return portfolio: 41 25
- Equity securities 28 13
- Real estate 8 4
- Other 5 8
100 100
Philips Annual Report 2008234
180
Sustainability performance
244
Company financial statements
124
US GAAP financial statements
192
IFRS financial statements
Notes to the IFRS financial
statements