Philips 2008 Annual Report Download - page 226
Download and view the complete annual report
Please find page 226 of the 2008 Philips annual report below. You can navigate through the pages in the report by either clicking on the pages listed below, or by using the keyword search tool below to find specific information within the annual report.-
 1
1 -
2
-
3
-
4
-
5
-
6
-
7
-
8
-
9
-
10
-
11
-
12
-
13
-
14
-
15
-
16
-
17
-
18
-
19
-
20
-
21
-
22
-
23
-
24
-
25
-
26
-
27
-
28
-
29
-
30
-
31
-
32
-
33
-
34
-
35
-
36
-
37
-
38
-
39
-
40
-
41
-
42
-
43
-
44
-
45
-
46
-
47
-
48
-
49
-
50
-
51
-
52
-
53
-
54
-
55
-
56
-
57
-
58
-
59
-
60
-
61
-
62
-
63
-
64
-
65
-
66
-
67
-
68
-
69
-
70
-
71
-
72
-
73
-
74
-
75
-
76
-
77
-
78
-
79
-
80
-
81
-
82
-
83
-
84
-
85
-
86
-
87
-
88
-
89
-
90
-
91
-
92
-
93
-
94
-
95
-
96
-
97
-
98
-
99
-
100
-
101
-
102
-
103
-
104
-
105
-
106
-
107
-
108
-
109
-
110
-
111
-
112
-
113
-
114
-
115
-
116
-
117
-
118
-
119
-
120
-
121
-
122
-
123
-
124
-
125
-
126
-
127
-
128
-
129
-
130
-
131
-
132
-
133
-
134
-
135
-
136
-
137
-
138
-
139
-
140
-
141
-
142
-
143
-
144
-
145
-
146
-
147
-
148
-
149
-
150
-
151
-
152
-
153
-
154
-
155
-
156
-
157
-
158
-
159
-
160
-
161
-
162
-
163
-
164
-
165
-
166
-
167
-
168
-
169
-
170
-
171
-
172
-
173
-
174
-
175
-
176
-
177
-
178
-
179
-
180
-
181
-
182
-
183
-
184
-
185
-
186
-
187
-
188
-
189
-
190
-
191
-
192
-
193
-
194
-
195
-
196
-
197
-
198
-
199
-
200
-
201
-
202
-
203
-
204
-
205
-
206
-
207
-
208
-
209
-
210
-
211
-
212
-
213
-
214
-
215
-
 216
216 -
 217
217 -
 218
218 -
 219
219 -
 220
220 -
 221
221 -
 222
222 -
 223
223 -
 224
224 -
 225
225 -
 226
226 -
 227
227 -
 228
228 -
 229
229 -
 230
230 -
 231
231 -
 232
232 -
 233
233 -
 234
234 -
 235
235 -
 236
236 -
237
-
238
-
239
-
240
-
241
-
242
-
243
-
244
-
245
-
246
-
247
-
248
-
249
-
250
-
251
-
252
-
253
-
254
-
255
-
256
-
257
-
258
-
259
-
260
-
261
-
262
-
263
-
264
-
265
-
266
-
267
-
268
-
269
-
270
-
271
-
272
-
273
-
274
-
275
-
276
 |
 |

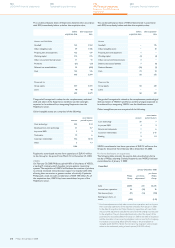
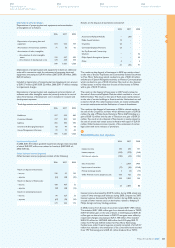
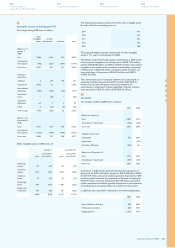
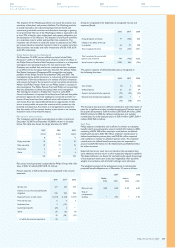
Deferred tax assets and liabilities relate to the following balance sheet
captions, as follows:
assets liabilities net
2008
Intangible assets 112 (1,410) (1,298)
Property, plant & equipment 62 (208) (146)
Inventories 160 (13) 147
Prepaid pension costs 52 (562) (510)
Other receivables 49 (8) 41
Other assets 82 (21) 61
Provisions:
- Pensions 432 −432
- Guarantees 10 (1) 9
- Termination benefits 61 −61
- Other postretirement 108 −108
- Other 803 (52) 751
Other liabilities 152 (76) 76
2,083 (2,351) (268)
Set-off of deferred tax positions (1,767) 1,767 −
316 (584) (268)
assets liabilities net
2007
Intangible assets 43 (414) (371)
Property, plant & equipment 120 (55) 65
Inventories 164 (32) 132
Prepaid pension costs 18 (703) (685)
Other receivables 36 (15) 21
Other assets 60 (26) 34
Provisions:
- Pensions 353 −353
- Guarantees 13 −13
- Termination benefits 19 −19
- Other postretirement 116 −116
- Other 422 (293) 129
Other liabilities 128 (35) 93
1,492 (1,573) (81)
Set-off of deferred tax positions (921) 921 −
571 (652) (81)
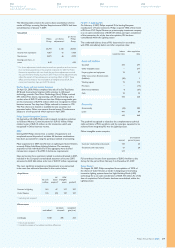
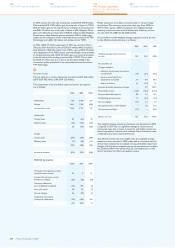
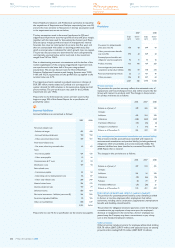
In assessing the realizability of deferred tax assets, management considers
whether it is probable that some portion or all of the deferred tax
assets will not be realized. The ultimate realization of deferred tax
assets is dependent upon the generation of future taxable income
during the periods in which those temporary differences become
deductible. Management considers the scheduled reversal of deferred
tax liabilities, projected future taxable income and tax planning
strategies in making this assessment. In order to fully realize the
deferred tax asset, the Company will need to generate future taxable
income in the countries where the net operating losses were incurred.
Based upon the level of historical taxable income and projections for
future taxable income over the periods in which the deferred tax
assets are deductible, management believes as at December 31, 2008,
it is probable that the Company will realize all or some portion of
the recognized benefits of these deductible differences.
At December 31, 2008, operating loss carryforwards expire as follows:
Total 2009 2010 2011 2012 2013
2014/
2018 later
un-
limited
4,198 14 16 58 12 8 27 852 3,211
The Company also has tax credit carryforwards of EUR 107 million,
which are available to offset future tax, if any, and which expire as follows:
Total 2009 2010 2011 2012 2013
2014/
2018 later
un-
limited
107 22573124927
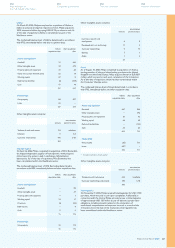
At December 31, 2008, operating loss and tax credit carryforwards
for which no deferred tax assets have been recognized in the balance
sheet, expire as follows:
Total 2009 2010 2011 2012 2013
2014
/2018 later
un-
limited
1,404 9 14 58 11 8 35 77 1,192
Classification of the income tax payable and receivable is as follows:
2007 2008
Income tax receivable - under current receivables 52 133
Income tax receivable - under non-current
receivables 14 1
Income tax payable - under accrued liabilities (154) (132)
Income tax payable - under non-current liabilities (1) (1)
43
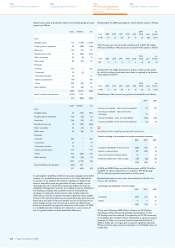
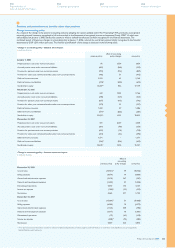
Investments in equity-accounted investees
Results relating to investments in equity-accounted investees
2006 2007 2008
Company’s participation in income (loss)
(188) 246 81
Results on sales of shares 106 660 (2)
Gains and losses from dilution effects 13 −12
Investment impairment / other charges (70) (22) (72)
(139) 884 19
In 2006 and 2008, Philips recorded dilution gains of EUR 13 million
and EUR 12 million respectively on its share in TPV Technology
(TPV), a Hong Kong-based manufacturer of flat panels.
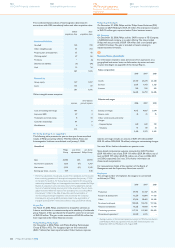
Detailed information on the other aforementioned individual line
items is set out below.
Company’s participation in income (loss)
2006 2007 2008
LG Display (192) 241 66
Others 4 5 15
(188) 246 81
At the end of February 2008, Philips’ influence on LG Display’s
operating and financial policies including representation on the
LG Display board was reduced. Consequently, the 19.9% investment
in LG Display was transferred from Investments in equity-accounted
investees to Other non-current financial assets effective March 1,
2008 as Philips was no longer able to exercise significant influence.
Philips ceased to apply equity accounting for its LG Display shares as
of that date.
Philips Annual Report 2008226
180
Sustainability performance
244
Company financial statements
124
US GAAP financial statements
192
IFRS financial statements
Notes to the IFRS financial
statements