Philips 2008 Annual Report Download - page 39
Download and view the complete annual report
Please find page 39 of the 2008 Philips annual report below. You can navigate through the pages in the report by either clicking on the pages listed below, or by using the keyword search tool below to find specific information within the annual report.-
 1
1 -
2
-
3
-
4
-
5
-
6
-
7
-
8
-
9
-
10
-
11
-
12
-
13
-
14
-
15
-
16
-
17
-
18
-
19
-
20
-
21
-
22
-
23
-
24
-
25
-
26
-
27
-
28
-
 29
29 -
 30
30 -
 31
31 -
 32
32 -
 33
33 -
 34
34 -
 35
35 -
 36
36 -
 37
37 -
 38
38 -
 39
39 -
 40
40 -
 41
41 -
 42
42 -
 43
43 -
 44
44 -
 45
45 -
 46
46 -
 47
47 -
 48
48 -
 49
49 -
50
-
51
-
52
-
53
-
54
-
55
-
56
-
57
-
58
-
59
-
60
-
61
-
62
-
63
-
64
-
65
-
66
-
67
-
68
-
69
-
70
-
71
-
72
-
73
-
74
-
75
-
76
-
77
-
78
-
79
-
80
-
81
-
82
-
83
-
84
-
85
-
86
-
87
-
88
-
89
-
90
-
91
-
92
-
93
-
94
-
95
-
96
-
97
-
98
-
99
-
100
-
101
-
102
-
103
-
104
-
105
-
106
-
107
-
108
-
109
-
110
-
111
-
112
-
113
-
114
-
115
-
116
-
117
-
118
-
119
-
120
-
121
-
122
-
123
-
124
-
125
-
126
-
127
-
128
-
129
-
130
-
131
-
132
-
133
-
134
-
135
-
136
-
137
-
138
-
139
-
140
-
141
-
142
-
143
-
144
-
145
-
146
-
147
-
148
-
149
-
150
-
151
-
152
-
153
-
154
-
155
-
156
-
157
-
158
-
159
-
160
-
161
-
162
-
163
-
164
-
165
-
166
-
167
-
168
-
169
-
170
-
171
-
172
-
173
-
174
-
175
-
176
-
177
-
178
-
179
-
180
-
181
-
182
-
183
-
184
-
185
-
186
-
187
-
188
-
189
-
190
-
191
-
192
-
193
-
194
-
195
-
196
-
197
-
198
-
199
-
200
-
201
-
202
-
203
-
204
-
205
-
206
-
207
-
208
-
209
-
210
-
211
-
212
-
213
-
214
-
215
-
216
-
217
-
218
-
219
-
220
-
221
-
222
-
223
-
224
-
225
-
226
-
227
-
228
-
229
-
230
-
231
-
232
-
233
-
234
-
235
-
236
-
237
-
238
-
239
-
240
-
241
-
242
-
243
-
244
-
245
-
246
-
247
-
248
-
249
-
250
-
251
-
252
-
253
-
254
-
255
-
256
-
257
-
258
-
259
-
260
-
261
-
262
-
263
-
264
-
265
-
266
-
267
-
268
-
269
-
270
-
271
-
272
-
273
-
274
-
275
-
276
 |
 |

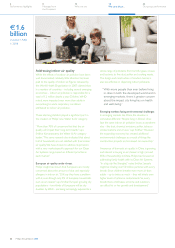
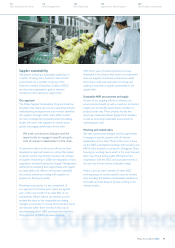
Operational energy efficiency
Focusing on operational energy efficiency is not only
essential to reduce our greenhouse-gas emissions,
including CO2, it also drives overall efficiency and savings.
In this context we have identified a number of
strategic initiatives driven by dedicated teams to
further strengthen the energy efficiency of our
operations and reduce our greenhouse-gas emissions
including CO2. All initiatives are sponsored by senior
executives and progress is closely monitored.
Examples include systematic energy scans at our
manufacturing sites globally, Green IT, Green Logistics,
Green Facility management and Green Supply Chain.
While some of these initiatives may primarily have a
financial impact, others engage our employees, influencing
them to make simple switches that have a big impact,
and some, like the examples below, offer both.
We have identified a number of strategic
initiatives to further strengthen the energy
efficiency of our operations and reduce our
greenhouse-gas emissions.
Our Green IT initiative addresses our use of computers
and accompanying peripherals, as well as IT infrastructure
.
Elements of the project include providing employees
with green computing tips and allowing them to
submit their ideas, as well as encouraging them to be
energy educators. Green IT power scan results are
published weekly, illustrating the declining percentage
of PCs online at night in each region.
To reduce business travel, we have introduced a new
video-conferencing system available via the intranet
that is as easy as face-to-face and is available for
virtual team-gatherings around the world.
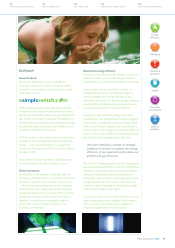
EcoVision4
Green Products
We use the Philips Green logo to identify an
increasing number of our Green Products, making
it simple for our customers and end-users to make
responsible choices.
With increasing concern about the impact of CO2
emissions on the climate, we will continue to ensure
that our products offer superior energy efficiency. We
also remain committed to giving our full attention to
all relevant environmental and social dimensions, including
the chemical content of products and reliable as well
as effective collection and recycling.
In 1994 we were at the forefront when we developed
procedures for Environmentally Conscious Product
Design – what we call EcoDesign. To support this
process, we
introduced our Green Focal Areas (shown
far right) in 1998.
Today Green Products represent a significant share
of our revenues in all of the markets we serve.
Green Innovations
Sustainability is recognized as a strategic driver for
innovation at Philips. With our commitment to Green
Innovations we are looking at today and tomorrow
– what we can simply categorize as now (roadmap
development), soon (adjacencies, which can also be
outside the scope of our current portfolio) and later
(breakaway innovations). Our research portfolio is
regularly reviewed from a sustainability angle to
ensure that we are on track to deliver on our
EcoVision commitments.
Energy
efficiency
Packaging
Hazardous
substances
Weight
Recycling
and disposal
Lifetime
reliability
Philips Annual Report 2008 39
122
Performance statements
114
Supervisory Board report
110
Our leadership
94
Risk management
70
Our sector performance