Philips 2008 Annual Report Download - page 195
Download and view the complete annual report
Please find page 195 of the 2008 Philips annual report below. You can navigate through the pages in the report by either clicking on the pages listed below, or by using the keyword search tool below to find specific information within the annual report.-
 1
1 -
2
-
3
-
4
-
5
-
6
-
7
-
8
-
9
-
10
-
11
-
12
-
13
-
14
-
15
-
16
-
17
-
18
-
19
-
20
-
21
-
22
-
23
-
24
-
25
-
26
-
27
-
28
-
29
-
30
-
31
-
32
-
33
-
34
-
35
-
36
-
37
-
38
-
39
-
40
-
41
-
42
-
43
-
44
-
45
-
46
-
47
-
48
-
49
-
50
-
51
-
52
-
53
-
54
-
55
-
56
-
57
-
58
-
59
-
60
-
61
-
62
-
63
-
64
-
65
-
66
-
67
-
68
-
69
-
70
-
71
-
72
-
73
-
74
-
75
-
76
-
77
-
78
-
79
-
80
-
81
-
82
-
83
-
84
-
85
-
86
-
87
-
88
-
89
-
90
-
91
-
92
-
93
-
94
-
95
-
96
-
97
-
98
-
99
-
100
-
101
-
102
-
103
-
104
-
105
-
106
-
107
-
108
-
109
-
110
-
111
-
112
-
113
-
114
-
115
-
116
-
117
-
118
-
119
-
120
-
121
-
122
-
123
-
124
-
125
-
126
-
127
-
128
-
129
-
130
-
131
-
132
-
133
-
134
-
135
-
136
-
137
-
138
-
139
-
140
-
141
-
142
-
143
-
144
-
145
-
146
-
147
-
148
-
149
-
150
-
151
-
152
-
153
-
154
-
155
-
156
-
157
-
158
-
159
-
160
-
161
-
162
-
163
-
164
-
165
-
166
-
167
-
168
-
169
-
170
-
171
-
172
-
173
-
174
-
175
-
176
-
177
-
178
-
179
-
180
-
181
-
182
-
183
-
184
-
 185
185 -
 186
186 -
 187
187 -
 188
188 -
 189
189 -
 190
190 -
 191
191 -
 192
192 -
 193
193 -
 194
194 -
 195
195 -
 196
196 -
 197
197 -
 198
198 -
 199
199 -
 200
200 -
 201
201 -
 202
202 -
 203
203 -
 204
204 -
 205
205 -
206
-
207
-
208
-
209
-
210
-
211
-
212
-
213
-
214
-
215
-
216
-
217
-
218
-
219
-
220
-
221
-
222
-
223
-
224
-
225
-
226
-
227
-
228
-
229
-
230
-
231
-
232
-
233
-
234
-
235
-
236
-
237
-
238
-
239
-
240
-
241
-
242
-
243
-
244
-
245
-
246
-
247
-
248
-
249
-
250
-
251
-
252
-
253
-
254
-
255
-
256
-
257
-
258
-
259
-
260
-
261
-
262
-
263
-
264
-
265
-
266
-
267
-
268
-
269
-
270
-
271
-
272
-
273
-
274
-
275
-
276
 |
 |

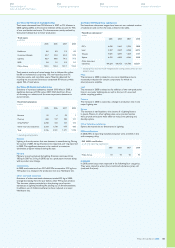
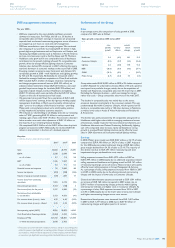
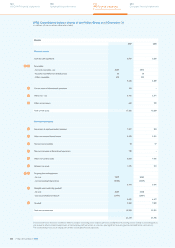
Cash flows from investing activities were an outflow of EUR 3,254
million in 2008, mainly due to EUR 5,316 million cash used for
acquisitions, notably Respironics (EUR 3,196 million), Genlyte
(EUR 1,894 million) and VISICU (EUR 198 million), as well as EUR 875
million used for net capital expenditures. These outflows were partly
offset by inflows amounting to EUR 2,576 million from the sale of
other non-current financial assets, mainly TSMC (EUR 1,831 million)
and LG Display (EUR 670 million), as well as the maturing of derivatives
which led to a net cash inflow of EUR 337 million.
2007 cash flows from investing activities amounted to an inflow of
EUR 3,700 million as a result of EUR 5,745 million of proceeds, mainly
from the sale of other non-current financial assets (mainly TSMC)
and businesses (mainly LG Display) and the maturing of currency
hedges (EUR 385 million). These inflows were partly offset by cash
used for the acquisitions of PLI (EUR 561 million) and Color Kinetics
(EUR 515 million) and net capital expenditures (EUR 928 million).
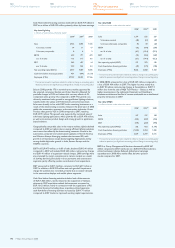
Philips sectors
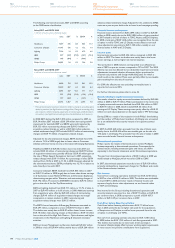
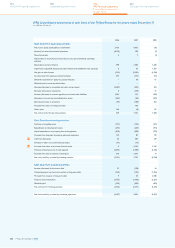
Key data Healthcare
in millions of euros unless otherwise stated
20061) 20071) 2008
Sales 6,562 6,638 7,649
% increase, nominal 9 1 15
% increase, comparable 8 4 6
EBITA 881 861 863
as a % of sales 13.4 13.0 11.3
EBIT 770 724 645
as a % of sales 11.7 10.9 8.4
Net operating capital (NOC) 4,640 4,758 8,785
Cash flows before financing activities (993) 227 (2,415)
Employees (FTEs) 27,223 29,191 35,551
1)
Prior-period amounts have been restated to reflect a change in accounting policy
related to pensions (see Significant accounting policies, Change in
accounting policy)
and revised to reflect immaterial adjustments of intercompany
profit elimination
on inventory (see Significant accounting policies, Reclassifications
and revisions)
In 2008, sales amounted to EUR 7,649 million, 15% higher than in 2007
on a nominal basis, largely thanks to the contributions from acquired
companies, notably Respironics. Excluding the 14% positive impact of
portfolio changes and the 5% unfavorable impact of currency effects,
comparable sales grew 6%. All businesses showed positive growth, led
by solid sales growth in Customer Services, Clinical Care Systems,
and Healthcare Informatics and Patient Monitoring. Higher sales within
Imaging Systems were supported by X-Ray and Nuclear Medicine,
partly tempered by lower sales at Computed Tomography. Green
Product sales amounted to EUR 1,527 million in 2008, up from
EUR 1,452 million in 2007, representing 20% of sector sales.
Geographically, double-digit comparable sales growth was achieved
in the key emerging markets, notably in China and Latin America,
driven by growth in all businesses. Also, single-digit sales growth was
recognized in the mature markets, across all businesses, notably
Imaging Systems and Clinical Care Systems.
EBITA of EUR 863 million, or 11.3% of sales, was in line with 2007
earnings of EUR 861 million. Earnings included EUR 90 million of
acquisition-related charges and EUR 63 million of restructuring charges,
which were partly offset by a EUR 45 million gain on the sale of Philips
Speech Recognition Systems. EBITA also included additional income
from Respironics and higher earnings at Clinical Care Systems and
Healthcare Informatics and Patient Monitoring, partially offset
by lower earnings at Imaging Systems.
Compared to 2007, EBIT declined EUR 79 million to EUR 645 million.
Cash flow before financing activities included net payments totaling
EUR 3,456 million, mainly for the acquisitions of Respironics, VISICU,
TOMCAT, Dixtal Biomédica, Shenzhen Goldway, Medel SpA and Alpha
X-Ray Technologies. In 2007, acquisition-related outflows amounted
to EUR 245 million, mainly for the acquisitions of Health Watch, Raytel
Cardiac Services, Emergin and VMI Sistemas Medicos. Excluding these
acquisition-related outflows, cash flow before financing activities was
EUR 569 million higher than in 2007, largely thanks to improved
working capital requirements, notably lower inventory.
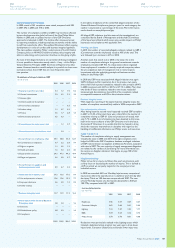
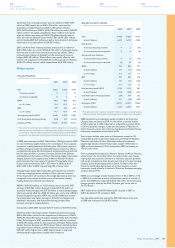
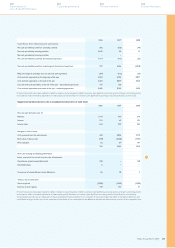
Key data Consumer Lifestyle
in millions of euros unless otherwise stated
20061) 20071) 2008
Sales 13,108 13,330 11,145
of which Television 6,559 6,270 4,980
Sales growth
% increase (decrease), nominal 4 2 (16)
% increase (decrease), comparable 6 4 (8)
Sales growth excl. Television
% increase (decrease), nominal 0 8 (13)
% increase (decrease), comparable (3) 10 (6)
EBITA 714 853 152
of which Television 151 (71) (426)
as a % of sales 5.4 6.4 1.4
EBIT 705 837 136
of which Television 151 (71) (426)
as a % of sales 5.4 6.3 1.2
Net operating capital (NOC) 1,126 1,113 825
of which Television (133) (208) (244)
Cash flows before financing activities (39) 754 252
of which Television 212 (49) (489)
Employees (FTEs) 24,419 23,397 17,346
of which Television 7,262 6,855 4,943
1)
Prior-period amounts have been restated to reflect a change in accounting policy
related to pensions (see Significant accounting policies, Change in
accounting policy)
2008 presented very challenging market conditions for Consumer
Lifestyle. Sales amounted to EUR 11,145 million, a nominal decline
of 16% compared to 2007. Adjusted for unfavorable currency effects
of 3% and portfolio changes, mainly the divestment of Television in
North America and the sale of the Set-Top Boxes and Mobile Phones
businesses, comparable sales declined by 8%.
Year-on-year declines were seen in all businesses, except for 4%
comparable growth in Domestic Appliances and Health & Wellness.
Television and Audio & Video Multimedia suffered comparable
double-digit declines. Green Product sales totaled 1,478 million in
2008, a nominal increase of 41% compared to 2007, amounting to
13% of sector sales.
From a geographical perspective, Western Europe and North America,
which account for more than half of the sector’s sales, were heavily
impacted by the economic downturn as well as by selective portfolio
and margin management. Sales growth was strong in the key emerging
markets, led by double-digit growth in Brazil. Growth in Asia was
driven by solid double-digit growth across the countries in most
businesses, mostly offset by a decline in Television. European emerging
markets declined 14%.
EBITA as a percentage of sales decreased from 6.4% in 2007 to 1.4%
in 2008, due to declines in nearly all businesses, mainly as a result of
lower sales. EBITA was impacted by EUR 192 million of restructuring
charges, partially offset by the EUR 42 million gain on the sale of
Set-Top Boxes.
EBIT declined from EUR 837 million (6.3% of sales) in 2007 to
EUR 136 million (1.2% of sales) in 2008.
Net operating capital was reduced by EUR 288 million at the end
of 2008 and amounted to EUR 825 million.
Philips Annual Report 2008 195
254
Corporate governance
250
Reconciliation of
non-US GAAP information
262
Ten-year overview
266
Investor information