Philips 2008 Annual Report Download - page 198
Download and view the complete annual report
Please find page 198 of the 2008 Philips annual report below. You can navigate through the pages in the report by either clicking on the pages listed below, or by using the keyword search tool below to find specific information within the annual report.-
 1
1 -
2
-
3
-
4
-
5
-
6
-
7
-
8
-
9
-
10
-
11
-
12
-
13
-
14
-
15
-
16
-
17
-
18
-
19
-
20
-
21
-
22
-
23
-
24
-
25
-
26
-
27
-
28
-
29
-
30
-
31
-
32
-
33
-
34
-
35
-
36
-
37
-
38
-
39
-
40
-
41
-
42
-
43
-
44
-
45
-
46
-
47
-
48
-
49
-
50
-
51
-
52
-
53
-
54
-
55
-
56
-
57
-
58
-
59
-
60
-
61
-
62
-
63
-
64
-
65
-
66
-
67
-
68
-
69
-
70
-
71
-
72
-
73
-
74
-
75
-
76
-
77
-
78
-
79
-
80
-
81
-
82
-
83
-
84
-
85
-
86
-
87
-
88
-
89
-
90
-
91
-
92
-
93
-
94
-
95
-
96
-
97
-
98
-
99
-
100
-
101
-
102
-
103
-
104
-
105
-
106
-
107
-
108
-
109
-
110
-
111
-
112
-
113
-
114
-
115
-
116
-
117
-
118
-
119
-
120
-
121
-
122
-
123
-
124
-
125
-
126
-
127
-
128
-
129
-
130
-
131
-
132
-
133
-
134
-
135
-
136
-
137
-
138
-
139
-
140
-
141
-
142
-
143
-
144
-
145
-
146
-
147
-
148
-
149
-
150
-
151
-
152
-
153
-
154
-
155
-
156
-
157
-
158
-
159
-
160
-
161
-
162
-
163
-
164
-
165
-
166
-
167
-
168
-
169
-
170
-
171
-
172
-
173
-
174
-
175
-
176
-
177
-
178
-
179
-
180
-
181
-
182
-
183
-
184
-
185
-
186
-
187
-
 188
188 -
 189
189 -
 190
190 -
 191
191 -
 192
192 -
 193
193 -
 194
194 -
 195
195 -
 196
196 -
 197
197 -
 198
198 -
 199
199 -
 200
200 -
 201
201 -
 202
202 -
 203
203 -
 204
204 -
 205
205 -
 206
206 -
 207
207 -
 208
208 -
209
-
210
-
211
-
212
-
213
-
214
-
215
-
216
-
217
-
218
-
219
-
220
-
221
-
222
-
223
-
224
-
225
-
226
-
227
-
228
-
229
-
230
-
231
-
232
-
233
-
234
-
235
-
236
-
237
-
238
-
239
-
240
-
241
-
242
-
243
-
244
-
245
-
246
-
247
-
248
-
249
-
250
-
251
-
252
-
253
-
254
-
255
-
256
-
257
-
258
-
259
-
260
-
261
-
262
-
263
-
264
-
265
-
266
-
267
-
268
-
269
-
270
-
271
-
272
-
273
-
274
-
275
-
276
 |
 |

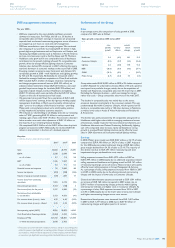
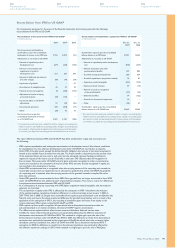
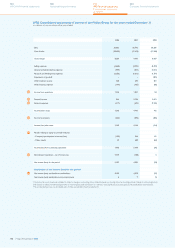
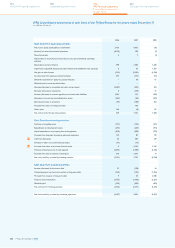
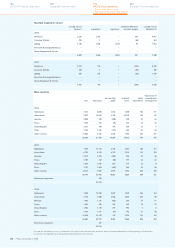
IFRS Consolidated statements of income of the Philips Group for the years ended December 31
in millions of euros unless otherwise stated
2006 2007 2008
Sales 26,682 26,793 26,385
Cost of sales (18,402) (17,603) (17,918)
Gross margin 8,280 9,190 8,467
Selling expenses (4,660) (4,975) (5,499)
General and administrative expenses (907) (851) (1,011)
Research and development expenses (1,556) (1,601) (1,777)
Impairment of goodwill −−(301)
Other business income 328 269 261
Other business expense (149) (165) (86)
Income from operations 1,336 1,867 54
Financial income 546 3,194 2,013
Financial expenses (517) (345) (1,925)
Income before taxes 1,365 4,716 142
Income tax expense (223) (582) (256)
Income (loss) after taxes 1,142 4,134 (114)
Results relating to equity-accounted investees:
- Company’s participation in income (loss) (188) 246 81
- Other results 49 638 (62)
Income (loss) from continuing operations 1,003 5,018 (95)
Discontinued operations - net of income tax 4,154 (138) 3
Net income (loss) for the period 5,157 4,880 (92)
Attribution of net income (loss) for the period
Net income (loss) attributable to stockholders 5,153 4,873 (91)
Net income (loss) attributable to minority interests 4 7 (1)
Prior-period amounts have been restated to reflect a change in accounting policy related to pensions (see Significant accounting policies, Change in accounting policy)
and revised to reflect immaterial adjustments of intercompany profit elimination on inventory (see Significant accounting policies, Reclassifications and revisions).
The accompanying notes are an integral part of these consolidated financial statements.
40
41
41
42
43
38
44
Philips Annual Report 2008198
180
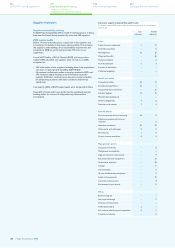
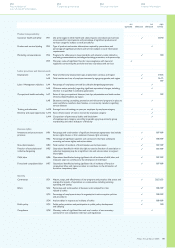
Sustainability performance
244
Company financial statements
124
US GAAP financial statements
192
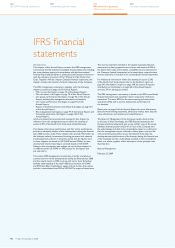
IFRS financial statements
Consolidated statements
of income