Philips 2008 Annual Report Download - page 265
Download and view the complete annual report
Please find page 265 of the 2008 Philips annual report below. You can navigate through the pages in the report by either clicking on the pages listed below, or by using the keyword search tool below to find specific information within the annual report.-
 1
1 -
2
-
3
-
4
-
5
-
6
-
7
-
8
-
9
-
10
-
11
-
12
-
13
-
14
-
15
-
16
-
17
-
18
-
19
-
20
-
21
-
22
-
23
-
24
-
25
-
26
-
27
-
28
-
29
-
30
-
31
-
32
-
33
-
34
-
35
-
36
-
37
-
38
-
39
-
40
-
41
-
42
-
43
-
44
-
45
-
46
-
47
-
48
-
49
-
50
-
51
-
52
-
53
-
54
-
55
-
56
-
57
-
58
-
59
-
60
-
61
-
62
-
63
-
64
-
65
-
66
-
67
-
68
-
69
-
70
-
71
-
72
-
73
-
74
-
75
-
76
-
77
-
78
-
79
-
80
-
81
-
82
-
83
-
84
-
85
-
86
-
87
-
88
-
89
-
90
-
91
-
92
-
93
-
94
-
95
-
96
-
97
-
98
-
99
-
100
-
101
-
102
-
103
-
104
-
105
-
106
-
107
-
108
-
109
-
110
-
111
-
112
-
113
-
114
-
115
-
116
-
117
-
118
-
119
-
120
-
121
-
122
-
123
-
124
-
125
-
126
-
127
-
128
-
129
-
130
-
131
-
132
-
133
-
134
-
135
-
136
-
137
-
138
-
139
-
140
-
141
-
142
-
143
-
144
-
145
-
146
-
147
-
148
-
149
-
150
-
151
-
152
-
153
-
154
-
155
-
156
-
157
-
158
-
159
-
160
-
161
-
162
-
163
-
164
-
165
-
166
-
167
-
168
-
169
-
170
-
171
-
172
-
173
-
174
-
175
-
176
-
177
-
178
-
179
-
180
-
181
-
182
-
183
-
184
-
185
-
186
-
187
-
188
-
189
-
190
-
191
-
192
-
193
-
194
-
195
-
196
-
197
-
198
-
199
-
200
-
201
-
202
-
203
-
204
-
205
-
206
-
207
-
208
-
209
-
210
-
211
-
212
-
213
-
214
-
215
-
216
-
217
-
218
-
219
-
220
-
221
-
222
-
223
-
224
-
225
-
226
-
227
-
228
-
229
-
230
-
231
-
232
-
233
-
234
-
235
-
236
-
237
-
238
-
239
-
240
-
241
-
242
-
243
-
244
-
245
-
246
-
247
-
248
-
249
-
250
-
251
-
252
-
253
-
254
-
 255
255 -
 256
256 -
 257
257 -
 258
258 -
 259
259 -
 260
260 -
 261
261 -
 262
262 -
 263
263 -
 264
264 -
 265
265 -
 266
266 -
 267
267 -
 268
268 -
 269
269 -
 270
270 -
 271
271 -
 272
272 -
 273
273 -
 274
274 -
 275
275 -
276
 |
 |

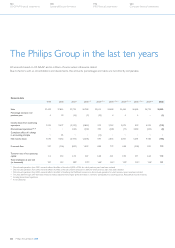
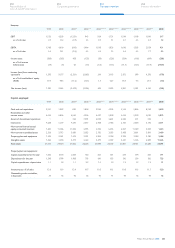
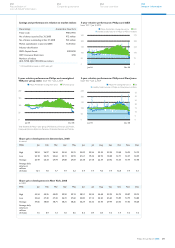
Key figures per share
1999 2000 20011) 20021) 2) 20031) 2) 3) 20041) 2) 3) 4) 20051) 2) 3) 4) 20061) 2) 3) 4) 2007
3) 4) 2008
Sales per common share 22.83 28.84 24.82 21.01 18.49 19.13 20.36 22.71 24.67 26.62
EBITA per common share - diluted 1.27 3.47 (0.63) 1.14 0.79 1.43 1.31 1.17 1.87 0.93
Income (loss) from continuing
operations per share 1.16 7.29 (1.82) (2.25) 0.17 2.47 2.30 0.77 4.23 (0.18)
Dividend paid per common share 0.25 0.30 0.36 0.36 0.36 0.36 0.40 0.44 0.60 0.70
Total shareholder return
per common share 19.70 5.57 (5.28) (16.32) 6.81 (3.28) 7.14 2.76 1.55 (14.99)
Stockholders' equity
per common share 12.55 17.69 15.04 10.91 9.97 11.57 13.85 20.75 20.32 17.60
Price/earnings ratio 29.16 5.35 (18.30) (7.74) 134.99 7.90 11.41 37.10 6.98 (76.83)
Share price at year-end 33.75 39.02 33.38 16.70 23.15 19.51 26.25 28.57 29.52 13.83
Highest share price during the year 33.90 57.25 44.20 35.40 24.86 26.20 26.70 29.31 32.99 28.94
Lowest share price during the year 14.66 31.21 18.03 13.25 12.65 17.89 18.53 21.89 26.71 12.09
Average share price 22.77 46.37 31.66 25.58 18.79 21.45 21.59 26.57 29.73 21.42
Common shares outstanding
at year-end
1) 1,332 1,284 1,274 1,276 1,281 1,282 1,201 1,107 1,065 923
Weighted average shares outstanding
- basic
1) 1,378 1,313 1,278 1,275 1,277 1,280 1,250 1,175 1,086 991
- diluted
1) 1,389 1,327 1,287 1,279 1,281 1,284 1,253 1,183 1,097 998
in millions of shares
1)
Philips Annual Report 2008 265
254
Corporate governance
250
Reconciliation of
non-US GAAP information
262
Ten-year over view
266
Investor information