Philips 2008 Annual Report Download - page 202
Download and view the complete annual report
Please find page 202 of the 2008 Philips annual report below. You can navigate through the pages in the report by either clicking on the pages listed below, or by using the keyword search tool below to find specific information within the annual report.-
 1
1 -
2
-
3
-
4
-
5
-
6
-
7
-
8
-
9
-
10
-
11
-
12
-
13
-
14
-
15
-
16
-
17
-
18
-
19
-
20
-
21
-
22
-
23
-
24
-
25
-
26
-
27
-
28
-
29
-
30
-
31
-
32
-
33
-
34
-
35
-
36
-
37
-
38
-
39
-
40
-
41
-
42
-
43
-
44
-
45
-
46
-
47
-
48
-
49
-
50
-
51
-
52
-
53
-
54
-
55
-
56
-
57
-
58
-
59
-
60
-
61
-
62
-
63
-
64
-
65
-
66
-
67
-
68
-
69
-
70
-
71
-
72
-
73
-
74
-
75
-
76
-
77
-
78
-
79
-
80
-
81
-
82
-
83
-
84
-
85
-
86
-
87
-
88
-
89
-
90
-
91
-
92
-
93
-
94
-
95
-
96
-
97
-
98
-
99
-
100
-
101
-
102
-
103
-
104
-
105
-
106
-
107
-
108
-
109
-
110
-
111
-
112
-
113
-
114
-
115
-
116
-
117
-
118
-
119
-
120
-
121
-
122
-
123
-
124
-
125
-
126
-
127
-
128
-
129
-
130
-
131
-
132
-
133
-
134
-
135
-
136
-
137
-
138
-
139
-
140
-
141
-
142
-
143
-
144
-
145
-
146
-
147
-
148
-
149
-
150
-
151
-
152
-
153
-
154
-
155
-
156
-
157
-
158
-
159
-
160
-
161
-
162
-
163
-
164
-
165
-
166
-
167
-
168
-
169
-
170
-
171
-
172
-
173
-
174
-
175
-
176
-
177
-
178
-
179
-
180
-
181
-
182
-
183
-
184
-
185
-
186
-
187
-
188
-
189
-
190
-
191
-
 192
192 -
 193
193 -
 194
194 -
 195
195 -
 196
196 -
 197
197 -
 198
198 -
 199
199 -
 200
200 -
 201
201 -
 202
202 -
 203
203 -
 204
204 -
 205
205 -
 206
206 -
 207
207 -
 208
208 -
 209
209 -
 210
210 -
 211
211 -
 212
212 -
213
-
214
-
215
-
216
-
217
-
218
-
219
-
220
-
221
-
222
-
223
-
224
-
225
-
226
-
227
-
228
-
229
-
230
-
231
-
232
-
233
-
234
-
235
-
236
-
237
-
238
-
239
-
240
-
241
-
242
-
243
-
244
-
245
-
246
-
247
-
248
-
249
-
250
-
251
-
252
-
253
-
254
-
255
-
256
-
257
-
258
-
259
-
260
-
261
-
262
-
263
-
264
-
265
-
266
-
267
-
268
-
269
-
270
-
271
-
272
-
273
-
274
-
275
-
276
 |
 |

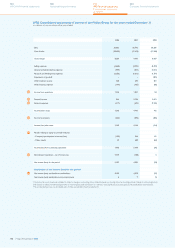
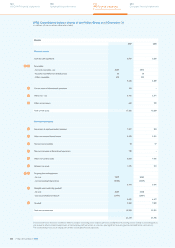
IFRS Consolidated statements of cash flows of the Philips Group for the years ended December 31
in millions of euros
2006 2007 2008
Cash flows from operating activities
Net income (loss) attributable to stockholders 5,153 4,873 (91)
(Income) loss from discontinued operations (4,154) 138 (3)
Minority interests 4 7 (1)
Adjustments to reconcile net income (loss) to net cash provided by operating
activities:
Depreciation and amortization 990 1,083 1,528
Impairment of goodwill, equity-accounted investees and available-for-sale securities 8 39 1,509
Net gain on sale of assets (232) (3,385) (1,536)
Loss (income) from equity-accounted investees 237 (371) (91)
Dividends received from equity-accounted investees −48 65
Dividends paid to minority shareholders −−−
(Increase) decrease in receivables and other current assets (2,067) (435) 234
Decrease (increase) in inventories 5 (378) 41
Increase (decrease) in accounts payable, accrued and other liabilities 1,042 121 (185)
(Increase) in non-current receivables/other assets (432) (68) (341)
(Decrease) increase in provisions (59) (108) 432
Proceeds from sales of trading securities −196 −
Other items 144 (8) 87
Net cash provided by operating activities 639 1,752 1,648
Cash flows from investing activities
Purchase of intangible assets (101) (118) (121)
Expenditures on development assets (295) (233) (154)
Capital expenditures on property, plant and equipment (698) (658) (770)
Proceeds from disposals of property, plant and equipment 107 81 170
Cash from derivatives 62 385 337
Purchase of other non-current financial assets (31) (17) −
Proceeds from other non-current financial assets 4 4,105 2,576
Purchase of businesses, net of cash acquired (2,467) (1,485) (5,316)
Proceeds from sale of interests in businesses 318 1,640 24
Net cash (used for) provided by investing activities (3,101) 3,700 (3,254)
Cash flows from financing activities
Increase (decrease) in short-term debt 97 (158) 18
Principal payments on short-term portion of long-term debt (553) (155) (1,726)
Proceeds from issuance of long-term debt 9 29 2,088
Treasury stock transactions (2,755) (1,448) (3,257)
Dividends paid (523) (639) (698)
Net cash used for financing activities (3,725) (2,371) (3,575)
Net cash (used for) provided by continuing operations (6,187) 3,081 (5,181)
64
65
Philips Annual Report 2008202
180
Sustainability performance
244
Company financial statements
124
US GAAP financial statements
192
IFRS financial statements
Consolidated statements
of cash flows