Philips 2008 Annual Report Download - page 251
Download and view the complete annual report
Please find page 251 of the 2008 Philips annual report below. You can navigate through the pages in the report by either clicking on the pages listed below, or by using the keyword search tool below to find specific information within the annual report.-
 1
1 -
2
-
3
-
4
-
5
-
6
-
7
-
8
-
9
-
10
-
11
-
12
-
13
-
14
-
15
-
16
-
17
-
18
-
19
-
20
-
21
-
22
-
23
-
24
-
25
-
26
-
27
-
28
-
29
-
30
-
31
-
32
-
33
-
34
-
35
-
36
-
37
-
38
-
39
-
40
-
41
-
42
-
43
-
44
-
45
-
46
-
47
-
48
-
49
-
50
-
51
-
52
-
53
-
54
-
55
-
56
-
57
-
58
-
59
-
60
-
61
-
62
-
63
-
64
-
65
-
66
-
67
-
68
-
69
-
70
-
71
-
72
-
73
-
74
-
75
-
76
-
77
-
78
-
79
-
80
-
81
-
82
-
83
-
84
-
85
-
86
-
87
-
88
-
89
-
90
-
91
-
92
-
93
-
94
-
95
-
96
-
97
-
98
-
99
-
100
-
101
-
102
-
103
-
104
-
105
-
106
-
107
-
108
-
109
-
110
-
111
-
112
-
113
-
114
-
115
-
116
-
117
-
118
-
119
-
120
-
121
-
122
-
123
-
124
-
125
-
126
-
127
-
128
-
129
-
130
-
131
-
132
-
133
-
134
-
135
-
136
-
137
-
138
-
139
-
140
-
141
-
142
-
143
-
144
-
145
-
146
-
147
-
148
-
149
-
150
-
151
-
152
-
153
-
154
-
155
-
156
-
157
-
158
-
159
-
160
-
161
-
162
-
163
-
164
-
165
-
166
-
167
-
168
-
169
-
170
-
171
-
172
-
173
-
174
-
175
-
176
-
177
-
178
-
179
-
180
-
181
-
182
-
183
-
184
-
185
-
186
-
187
-
188
-
189
-
190
-
191
-
192
-
193
-
194
-
195
-
196
-
197
-
198
-
199
-
200
-
201
-
202
-
203
-
204
-
205
-
206
-
207
-
208
-
209
-
210
-
211
-
212
-
213
-
214
-
215
-
216
-
217
-
218
-
219
-
220
-
221
-
222
-
223
-
224
-
225
-
226
-
227
-
228
-
229
-
230
-
231
-
232
-
233
-
234
-
235
-
236
-
237
-
238
-
239
-
240
-
 241
241 -
 242
242 -
 243
243 -
 244
244 -
 245
245 -
 246
246 -
 247
247 -
 248
248 -
 249
249 -
 250
250 -
 251
251 -
 252
252 -
 253
253 -
 254
254 -
 255
255 -
 256
256 -
 257
257 -
 258
258 -
 259
259 -
 260
260 -
 261
261 -
262
-
263
-
264
-
265
-
266
-
267
-
268
-
269
-
270
-
271
-
272
-
273
-
274
-
275
-
276
 |
 |

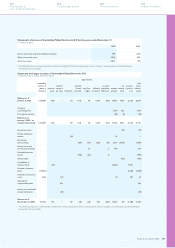
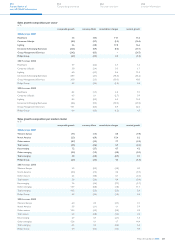
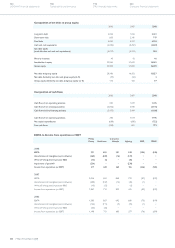
Sales growth composition per sector
in %
comparable growth currency effects consolidation changes nominal growth
2008 versus 2007
Healthcare 5.6 (4.5) 14.1 15.2
Consumer Lifestyle (8.5) (2.7) (5.2) (16.4)
Lighting 2.6 (3.8) 17.8 16.6
Innovation & Emerging Businesses (26.6) (0.9) (9.6) (37.1)
Group Management & Services (24.2) (0.5) −(24.7)
Philips Group (2.7) (3.3) 4.5 (1.5)
2007 versus 2006
Healthcare 3.7 (5.2) 2.7 1.2
Consumer Lifestyle 3.8 (2.4) 0.3 1.7
Lighting 6.0 (3.1) 8.6 11.5
Innovation & Emerging Businesses 38.4 (3.1) (96.5) (61.2)
Group Management & Services 30.8 (2.3) (10.5) 18.0
Philips Group 4.9 (3.3) (1.2) 0.4
2006 versus 2005
Healthcare 8.2 (1.1) 2.0 9.1
Consumer Lifestyle 6.5 0.1 (2.7) 3.9
Lighting 8.3 (0.3) 6.5 14.5
Innovation & Emerging Businesses (8.6) (0.4) (18.5) (27.5)
Group Management & Services 14.1 (0.5) 8.9 22.5
Philips Group 6.4 (0.3) (1.2) 4.9
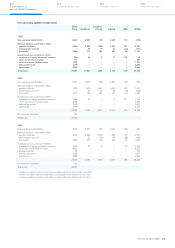
Sales growth composition per market cluster
in %
comparable growth currency effects consolidation changes nominal growth
2008 versus 2007
Western Europe (7.1) (1.5) 0.8 (7.8)
North America (2.3) (6.9) 15.4 6.2
Other mature (8.7) (3.2) 7.7 (4.2)
Total mature (5.5) (3.6) 6.9 (2.2)
Key emerging 7.2 (3.7) 0.7 4.2
Other emerging (0.3) (1.9) (2.8) (5.0)
Total emerging 3.8 (2.8) (0.9) 0.1
Philips Group (2.7) (3.3) 4.5 (1.5)
2007 versus 2006
Western Europe 5.2 (0.2) (1.0) 4.0
North America (0.4) (7.5) 2.0 (5.9)
Other mature 2.2 (4.8) 0.1 (2.5)
Total mature 2.8 (3.6) 0.4 (0.4)
Key emerging 7.6 (3.6) (7.7) (3.7)
Other emerging 13.7 (0.8) (1.8) 11.1
Total emerging 10.2 (2.5) (5.3) 2.4
Philips Group 4.9 (3.3) (1.2) 0.4
2006 versus 2005
Western Europe 6.0 0.2 (3.1) 3.1
North America 5.9 (1.1) 1.1 5.9
Other mature 10.4 (4.5) (2.0) 3.9
Total mature 6.3 (0.8) (1.3) 4.2
Key emerging 2.7 0.7 (2.1) 1.3
Other emerging 12.6 0.1 1.7 14.4
Total emerging 6.5 0.5 (0.6) 6.4
Philips Group 6.4 (0.3) (1.2) 4.9
Philips Annual Report 2008 251
254
Corporate governance
250
Reconciliation of
non-US GAAP information
262
Ten-year overview
266
Investor information