Philips 2008 Annual Report Download - page 184
Download and view the complete annual report
Please find page 184 of the 2008 Philips annual report below. You can navigate through the pages in the report by either clicking on the pages listed below, or by using the keyword search tool below to find specific information within the annual report.-
 1
1 -
2
-
3
-
4
-
5
-
6
-
7
-
8
-
9
-
10
-
11
-
12
-
13
-
14
-
15
-
16
-
17
-
18
-
19
-
20
-
21
-
22
-
23
-
24
-
25
-
26
-
27
-
28
-
29
-
30
-
31
-
32
-
33
-
34
-
35
-
36
-
37
-
38
-
39
-
40
-
41
-
42
-
43
-
44
-
45
-
46
-
47
-
48
-
49
-
50
-
51
-
52
-
53
-
54
-
55
-
56
-
57
-
58
-
59
-
60
-
61
-
62
-
63
-
64
-
65
-
66
-
67
-
68
-
69
-
70
-
71
-
72
-
73
-
74
-
75
-
76
-
77
-
78
-
79
-
80
-
81
-
82
-
83
-
84
-
85
-
86
-
87
-
88
-
89
-
90
-
91
-
92
-
93
-
94
-
95
-
96
-
97
-
98
-
99
-
100
-
101
-
102
-
103
-
104
-
105
-
106
-
107
-
108
-
109
-
110
-
111
-
112
-
113
-
114
-
115
-
116
-
117
-
118
-
119
-
120
-
121
-
122
-
123
-
124
-
125
-
126
-
127
-
128
-
129
-
130
-
131
-
132
-
133
-
134
-
135
-
136
-
137
-
138
-
139
-
140
-
141
-
142
-
143
-
144
-
145
-
146
-
147
-
148
-
149
-
150
-
151
-
152
-
153
-
154
-
155
-
156
-
157
-
158
-
159
-
160
-
161
-
162
-
163
-
164
-
165
-
166
-
167
-
168
-
169
-
170
-
171
-
172
-
173
-
 174
174 -
 175
175 -
 176
176 -
 177
177 -
 178
178 -
 179
179 -
 180
180 -
 181
181 -
 182
182 -
 183
183 -
 184
184 -
 185
185 -
 186
186 -
 187
187 -
 188
188 -
 189
189 -
 190
190 -
 191
191 -
 192
192 -
 193
193 -
 194
194 -
195
-
196
-
197
-
198
-
199
-
200
-
201
-
202
-
203
-
204
-
205
-
206
-
207
-
208
-
209
-
210
-
211
-
212
-
213
-
214
-
215
-
216
-
217
-
218
-
219
-
220
-
221
-
222
-
223
-
224
-
225
-
226
-
227
-
228
-
229
-
230
-
231
-
232
-
233
-
234
-
235
-
236
-
237
-
238
-
239
-
240
-
241
-
242
-
243
-
244
-
245
-
246
-
247
-
248
-
249
-
250
-
251
-
252
-
253
-
254
-
255
-
256
-
257
-
258
-
259
-
260
-
261
-
262
-
263
-
264
-
265
-
266
-
267
-
268
-
269
-
270
-
271
-
272
-
273
-
274
-
275
-
276
 |
 |

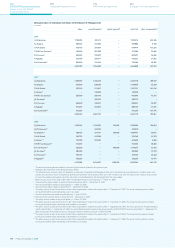
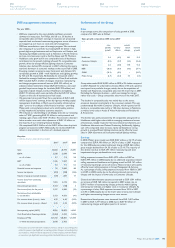
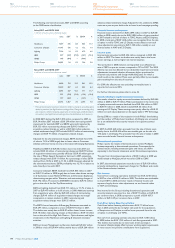
EcoVision III: CO2 emissions in manufacturing
The Greenhouse Gas Emissions of our manufacturing operations
totaled 825 kilo tons CO2 equivalents in 2008, 4% lower than 2007.
Both direct and indirect CO2 emissions related to energy use
decreased. This is particularly attributable to the increased use of
purchased electricity coming from renewable sources, which went up
significantly from 8% to 16%.
Total CO2 emissions in manufacturing
in kilotons CO2 equivalents
2005 2006 2007 2008
Direct CO2 335 326 321 302
Indirect CO2 551 473 465 434
Other greenhouse gases 144 40 40 61
From glass production 29 29 29 28
Total 1,059 868 855 825
The Lighting sector, which accounts for nearly 80% of total CO2
emissions, achieved a 5% reduction.
Total carbon emissions in manufacturing per sector
in kilotons CO2 equivalents
2005 2006 2007 2008
Healthcare 112 114 113 117
Consumer Lifestyle 65 63 65 65
Lighting 685 685 675 642
I&EB 197 6 2 1
Philips Group 1,059 868 855 825
EcoVision III: Water usage in manufacturing
Water is used primarily for domestic purposes, with the exception
of Lighting where it is also used in manufacturing. Total water intake
in 2008 was slightly below 4 million m3, 6% lower than in 2007. This
decrease was primarily realized in Lighting. In this sector less cooling
water was used, while water saving programs such as rain buffer
water recycling (treating the water from rain for additional supply),
installing stop valves for water taps etc. had a positive effect on
water consumption.
Water intake
in thousands m3
2005 2006 2007 2008
Healthcare 497 406 369 370
Consumer Lifestyle 695 509 485 456
Lighting 3,094 3,217 3,350 3,134
I&EB 1,112 39 5 6
Philips Group 5,398 4,171 4,209 3,966
In 2008, 66% of water was purchased and 34% was extracted from
groundwater wells.
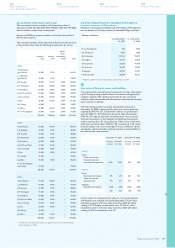
Overall CO
• 2 emissions from distribution increased 6% nominally,
and 1% on a comparable basis, excluding the acquisitions.
Representing nearly half of these total emissions, air transport was
up 1% nominally, but 2% lower on a comparable basis. Sea
transport increased 19%, due to various reasons like a targeted
shift from air to sea transport, new acquisitions and shipments
moving into our scope definition, which includes all shipments for
which Philips pays the transport. Road transport increased 2%, but
decreased 7% on a comparable basis due to improved truck
utilization and higher value density of some of our products.
Operational carbon footprint for distribution
in kilotons CO2 equivalents
2007 2008
Air transport 306 310
Road transport 211 217
Sea transport 144 172
Total Philips Group 661 699
For comparison, the most relevant ratios for CO2 emissions and
energy efficiency are provided below.
Ratios on carbon emissions and energy use
2007 2008
Operational CO2 emissions in kilotons
CO2 equivalents 2,127 2,147
Operational CO2 intensity in tons CO2 equivalents
per million euro sales 79.40 81.37
Operational energy use in terajoules 34,953 34,924
Operational energy intensity in terajoules
per million euro sales 1.30 1.32
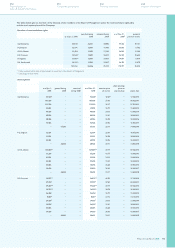
EcoVision III manufacturing targets
Our EcoVision III environmental action program began in 2006
and will run through 2009. Focused on reducing the impact of our
production processes, EcoVision III set reduction targets for all major
environmental parameters in manufacturing compared to the base
year 2005. Progress against our EcoVision III targets is detailed below.
EcoVision III: Energy use in manufacturing
Absolute energy usage amounted to 14,584 terajoules in 2008.
Compared with 2007, energy consumption at Philips Group level
decreased 4%. Further rationalization of production at Lighting
resulted in a 5% decrease in this sector, representing nearly 80%
of the total Group. In one of the major Lighting sites, the soda-lime
furnace was shut down, resulting in less electricity use.
Total energy consumption in manufacturing
in terajoules
2005 2006 2007 2008
Healthcare 1,539 1,569 1,600 1,609
Consumer Lifestyle 1,411 1,402 1,444 1,515
Lighting 12,131 12,086 12,090 11,426
I&EB 1,456 156 35 34
Philips Group 16,537 15,213 15,169 14,584
Philips Annual Report 2008184
180
Sustainability performance
Environmental indicators
192
IFRS financial statements
244
Company financial statements
124
US GAAP financial statements