Philips 2008 Annual Report Download - page 182
Download and view the complete annual report
Please find page 182 of the 2008 Philips annual report below. You can navigate through the pages in the report by either clicking on the pages listed below, or by using the keyword search tool below to find specific information within the annual report.-
 1
1 -
2
-
3
-
4
-
5
-
6
-
7
-
8
-
9
-
10
-
11
-
12
-
13
-
14
-
15
-
16
-
17
-
18
-
19
-
20
-
21
-
22
-
23
-
24
-
25
-
26
-
27
-
28
-
29
-
30
-
31
-
32
-
33
-
34
-
35
-
36
-
37
-
38
-
39
-
40
-
41
-
42
-
43
-
44
-
45
-
46
-
47
-
48
-
49
-
50
-
51
-
52
-
53
-
54
-
55
-
56
-
57
-
58
-
59
-
60
-
61
-
62
-
63
-
64
-
65
-
66
-
67
-
68
-
69
-
70
-
71
-
72
-
73
-
74
-
75
-
76
-
77
-
78
-
79
-
80
-
81
-
82
-
83
-
84
-
85
-
86
-
87
-
88
-
89
-
90
-
91
-
92
-
93
-
94
-
95
-
96
-
97
-
98
-
99
-
100
-
101
-
102
-
103
-
104
-
105
-
106
-
107
-
108
-
109
-
110
-
111
-
112
-
113
-
114
-
115
-
116
-
117
-
118
-
119
-
120
-
121
-
122
-
123
-
124
-
125
-
126
-
127
-
128
-
129
-
130
-
131
-
132
-
133
-
134
-
135
-
136
-
137
-
138
-
139
-
140
-
141
-
142
-
143
-
144
-
145
-
146
-
147
-
148
-
149
-
150
-
151
-
152
-
153
-
154
-
155
-
156
-
157
-
158
-
159
-
160
-
161
-
162
-
163
-
164
-
165
-
166
-
167
-
168
-
169
-
170
-
171
-
 172
172 -
 173
173 -
 174
174 -
 175
175 -
 176
176 -
 177
177 -
 178
178 -
 179
179 -
 180
180 -
 181
181 -
 182
182 -
 183
183 -
 184
184 -
 185
185 -
 186
186 -
 187
187 -
 188
188 -
 189
189 -
 190
190 -
 191
191 -
 192
192 -
193
-
194
-
195
-
196
-
197
-
198
-
199
-
200
-
201
-
202
-
203
-
204
-
205
-
206
-
207
-
208
-
209
-
210
-
211
-
212
-
213
-
214
-
215
-
216
-
217
-
218
-
219
-
220
-
221
-
222
-
223
-
224
-
225
-
226
-
227
-
228
-
229
-
230
-
231
-
232
-
233
-
234
-
235
-
236
-
237
-
238
-
239
-
240
-
241
-
242
-
243
-
244
-
245
-
246
-
247
-
248
-
249
-
250
-
251
-
252
-
253
-
254
-
255
-
256
-
257
-
258
-
259
-
260
-
261
-
262
-
263
-
264
-
265
-
266
-
267
-
268
-
269
-
270
-
271
-
272
-
273
-
274
-
275
-
276
 |
 |

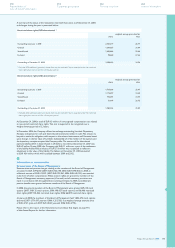
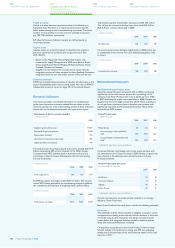
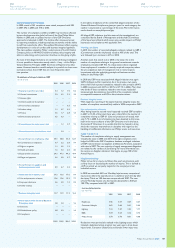
Total dividend paid to shareholders amounted to EUR 720 million.
This reflects the increase in dividend per share from EUR 0.60 to
EUR 0.70 per common share, paid in 2008.
in millions of euros
2006 2007 2008
Dividend paid 523 659 720
Corporate income taxes decreased significantly in 2008, mainly due
to substantially lower income. For a full understanding, please refer
to note 6.
in million of euros
2006 2007 2008
Corporate income taxes 166 619 286
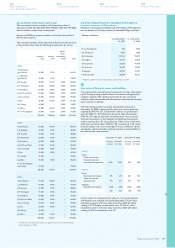
Environmental indicators
EcoVision4: Green Product sales
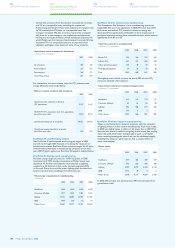
Sales from Green Products increased 12.5% in 2008, contributing
significantly to the total revenue stream. As a percentage of the
company total, Green Product sales rose to 22.6%, up from 19.8%
in 2007. Excluding the major new acquisitions in 2008 (Genlyte and
Respironics), the percentage increased to 24.9%. These acquisitions
do not yet have a process in place to develop new products with
significantly improved environmental performance. These will be
included from 2009 onward.
Green Product sales
in billions of euros
2006 2007 2008
Philips Group 4.0 5.3 6.0
as a percentage of total published
sales 15.0 19.8 22.6
as a percentage of comparable total
sales1) 15.0 19.8 24.9
adjusted for sales from new consolidations
1)
Consumer Lifestyle contributed most to the overall increase with
the introduction of 61 Green Products in 2008. Further progress was
also achieved in the Lighting sector, where the share of Green
Products increased.
Green Product sales per sector
as a percentage of total sales 1)
2007 2008
Healthcare 22 23
Consumer Lifestyle 8 13
Lighting 49 53
Philips Group 20 25
adjusted for sales from new consolidations
1)
Overall, improvements are predominantly realized in our energy
efficiency Green Focal Area.
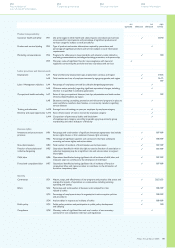
New Green Products from each sector include the following examples.
Healthcare
The CliniScape mobile clinical assistant is designed to support nurses
and physicians in making more informed clinical decisions at the point
of care by using an ultra-ergonomic and always connected touch-
screen device that integrates features needed to enhance patient
safety and reduce administrative workload.
Compared to its predecessor, this Green Product’s environmental
benefits include a 7% reduction in energy use, 45% less packaging
weight and an improvement of the environmental impact of the total
life cycle of 21%.
Health and safety
Health and safety data are reported monthly and validated on a
half-yearly basis. The focus is on reporting work-related injuries,
which predominantly occur in manufacturing operations. The annual
number of cases leading to at least one lost workday is reported
per 100 FTEs (full-time equivalents).
KPI (Key Performance Indicator) targets are defined yearly to
drive improvement.
Supplier audits
Supplier audits are primarily focused on identified risk suppliers,
based on identified risk countries and on spend of more than
EUR 100,000.
Based on the Maplecroft Human Rights Risk Indexes, risk
•
countries for Supply Management in 2008 were: Belarus, Brazil,
China, South Korea, Mexico, Malaysia, Philippines, Russia, Taiwan,
Thailand, Ukraine and Vietnam.
Suppliers of new ventures are included to the extent that the
•
integration process of these ventures has been finalized. Normative
integration period is two years after closure of the new venture.
External assurance
KPMG has provided limited assurance on whether the information in this
section Sustainability performance is fairly stated. We refer to KPMG’s
independent assurance report on page 189 of this Annual Report.
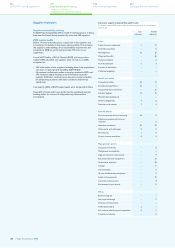
Economic indicators
This section provides summarized information on contributions
to the most important economic stakeholders as a basis to drive
economic growth. For a full understanding of each of these indicators,
please refer to the financial statements and notes in this report.
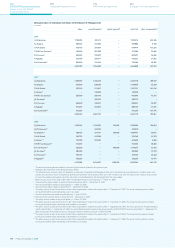
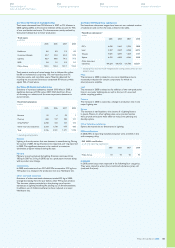
Distribution of direct economic benefits
in millions of euros
2008
Suppliers: goods and services 17,890
Employees: wages and pensions 5,098
Shareholders: dividend 720
Government: corporate income taxes 286
Capital providers: net interest 106
The total amount of purchased goods and services totaled EUR 17.9
billion, representing 68% of total revenues of the Philips Group.
Compared with 2007, spending both in absolute terms and as a
percentage of sales increased, reflecting the trend to outsourcing
and sub-contracting.
in billions of euros
2006 2007 2008
Total supply spend 18.4 17.6 17.9
In 2008 the salaries and wages totaled EUR 5.1 billion. The increase
versus 2007 relates particularly to restructuring charges. In addition,
the acquisitions at Healthcare and Lighting had an upward effect.
in millions of euros
2006 2007 2008
Total salaries and wages 4,613 4,607 5,098
Philips Annual Report 2008182
180
Sustainability performance
- Economic indicators
- Environmental indicators
192
IFRS financial statements
244
Company financial statements
124
US GAAP financial statements