Philips 2008 Annual Report Download - page 151
Download and view the complete annual report
Please find page 151 of the 2008 Philips annual report below. You can navigate through the pages in the report by either clicking on the pages listed below, or by using the keyword search tool below to find specific information within the annual report.-
 1
1 -
2
-
3
-
4
-
5
-
6
-
7
-
8
-
9
-
10
-
11
-
12
-
13
-
14
-
15
-
16
-
17
-
18
-
19
-
20
-
21
-
22
-
23
-
24
-
25
-
26
-
27
-
28
-
29
-
30
-
31
-
32
-
33
-
34
-
35
-
36
-
37
-
38
-
39
-
40
-
41
-
42
-
43
-
44
-
45
-
46
-
47
-
48
-
49
-
50
-
51
-
52
-
53
-
54
-
55
-
56
-
57
-
58
-
59
-
60
-
61
-
62
-
63
-
64
-
65
-
66
-
67
-
68
-
69
-
70
-
71
-
72
-
73
-
74
-
75
-
76
-
77
-
78
-
79
-
80
-
81
-
82
-
83
-
84
-
85
-
86
-
87
-
88
-
89
-
90
-
91
-
92
-
93
-
94
-
95
-
96
-
97
-
98
-
99
-
100
-
101
-
102
-
103
-
104
-
105
-
106
-
107
-
108
-
109
-
110
-
111
-
112
-
113
-
114
-
115
-
116
-
117
-
118
-
119
-
120
-
121
-
122
-
123
-
124
-
125
-
126
-
127
-
128
-
129
-
130
-
131
-
132
-
133
-
134
-
135
-
136
-
137
-
138
-
139
-
140
-
 141
141 -
 142
142 -
 143
143 -
 144
144 -
 145
145 -
 146
146 -
 147
147 -
 148
148 -
 149
149 -
 150
150 -
 151
151 -
 152
152 -
 153
153 -
 154
154 -
 155
155 -
 156
156 -
 157
157 -
 158
158 -
 159
159 -
 160
160 -
 161
161 -
162
-
163
-
164
-
165
-
166
-
167
-
168
-
169
-
170
-
171
-
172
-
173
-
174
-
175
-
176
-
177
-
178
-
179
-
180
-
181
-
182
-
183
-
184
-
185
-
186
-
187
-
188
-
189
-
190
-
191
-
192
-
193
-
194
-
195
-
196
-
197
-
198
-
199
-
200
-
201
-
202
-
203
-
204
-
205
-
206
-
207
-
208
-
209
-
210
-
211
-
212
-
213
-
214
-
215
-
216
-
217
-
218
-
219
-
220
-
221
-
222
-
223
-
224
-
225
-
226
-
227
-
228
-
229
-
230
-
231
-
232
-
233
-
234
-
235
-
236
-
237
-
238
-
239
-
240
-
241
-
242
-
243
-
244
-
245
-
246
-
247
-
248
-
249
-
250
-
251
-
252
-
253
-
254
-
255
-
256
-
257
-
258
-
259
-
260
-
261
-
262
-
263
-
264
-
265
-
266
-
267
-
268
-
269
-
270
-
271
-
272
-
273
-
274
-
275
-
276
 |
 |

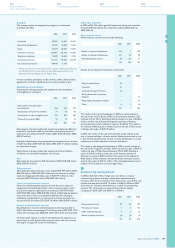
The movements in the provisions and liabilities for restructuring costs
in 2006 are presented by sector as follows:
Dec. 31,
2005
addi-
tions utilized released
other
changes1)
Dec. 31,
2006
Healthcare −14 (1) −−13
Consumer
Lifestyle 26 25 (29) (3) (1) 18
Lighting 6 43 (2) (2) −45
I&EB/
GM&S 30 −(11) −(3) 16
62 82 (43) (5) (4) 92
Other changes primarily relate to translation differences
1)
The total restructuring program charges in 2006 of EUR 82 million
are presented by sector as follows:
personnel
costs
write-
down of
assets
other
costs released total
Healthcare 13 −1−14
Consumer
Lifestyle 24 −1(3)22
Lighting 41 5 2 (2) 46
I&EB /
GM&S −−−−−
7854(5)82
5
Financial income and expenses
2006 2007 2008
Interest income 150 236 140
Interest expense (339) (279) (246)
Net interest expense (189) (43) (106)
Sale of securities −2,549 1,197
Impairment of securities (77) (36) (1,296)
Foreign exchange results 2 (1) (13)
Other financial income (expense), net 292 144 (7)
217 2,656 (119)
28 2,613 (225)
Interest income decreased by EUR 96 million during 2008, mainly as a
result of lower average cash balances during 2008, compared to 2007.
Interest expense decreased by EUR 33 million during 2008, mainly as
a result of lower interest costs on derivatives related to hedging of
Philips foreign currency funding positions.
In 2008, income from the sale of securities totaled EUR 1,197 million.
This included a EUR 1,082 million gain from the sale of shares in TSMC,
a EUR 83 million gain on the sale of shares in LG Display, and a EUR
16 million gain on the sale of shares in D&M. These gains were offset
by impairment charges amounting to EUR 1,296 million. This included
EUR 599 million for NXP, EUR 596 million for LG Display,
EUR 71
million for TPO and EUR 30 million for Pace Micro Technology.
Other
financial expense primarily consisted of a EUR 37 million loss related
to the revaluation of the convertible bond received from TPV
Technology, partially offset by a EUR 23 million dividend from TSMC.
In 2007, income from the sale of securities totaled EUR 2,549 million.
This included a EUR 2,528 million gain from the sale of shares in
TSMC
and a EUR 31 million gain on
the
sale of shares in Nuance
Communications,
partially offset by a EUR 10 million loss on the
sale of shares in JDS Uniphase. Impairment of securities consisted
of a charge of EUR 36 million for JDS Uniphase. Other financial
income included a EUR 12 million gain related to the revaluation of
the convertible bond received from TPV Technology and a EUR 128
million cash dividend from TSMC.
In 2006, a EUR 77 million impairment of TPO was recorded. Other
financial income totaled EUR 292 million, which included a cash
dividend of EUR 223 million from TSMC, a gain of EUR 97 million
upon designation of the TSMC shares received through a stock
dividend as trading securities and a EUR 29 million gain as a result
of increases in the fair value of the trading securities held in TSMC.
Additionally, it included a partially offsetting EUR 61 million loss as
a result of the fair value change in the conversion option embedded
in the convertible bond received from TPV Technology.
5
Philips Annual Report 2008 151
254
Corporate governance
250
Reconciliation of
non-US GAAP information
262
Ten-year overview
266
Investor information