Philips 2008 Annual Report Download - page 230
Download and view the complete annual report
Please find page 230 of the 2008 Philips annual report below. You can navigate through the pages in the report by either clicking on the pages listed below, or by using the keyword search tool below to find specific information within the annual report.-
 1
1 -
2
-
3
-
4
-
5
-
6
-
7
-
8
-
9
-
10
-
11
-
12
-
13
-
14
-
15
-
16
-
17
-
18
-
19
-
20
-
21
-
22
-
23
-
24
-
25
-
26
-
27
-
28
-
29
-
30
-
31
-
32
-
33
-
34
-
35
-
36
-
37
-
38
-
39
-
40
-
41
-
42
-
43
-
44
-
45
-
46
-
47
-
48
-
49
-
50
-
51
-
52
-
53
-
54
-
55
-
56
-
57
-
58
-
59
-
60
-
61
-
62
-
63
-
64
-
65
-
66
-
67
-
68
-
69
-
70
-
71
-
72
-
73
-
74
-
75
-
76
-
77
-
78
-
79
-
80
-
81
-
82
-
83
-
84
-
85
-
86
-
87
-
88
-
89
-
90
-
91
-
92
-
93
-
94
-
95
-
96
-
97
-
98
-
99
-
100
-
101
-
102
-
103
-
104
-
105
-
106
-
107
-
108
-
109
-
110
-
111
-
112
-
113
-
114
-
115
-
116
-
117
-
118
-
119
-
120
-
121
-
122
-
123
-
124
-
125
-
126
-
127
-
128
-
129
-
130
-
131
-
132
-
133
-
134
-
135
-
136
-
137
-
138
-
139
-
140
-
141
-
142
-
143
-
144
-
145
-
146
-
147
-
148
-
149
-
150
-
151
-
152
-
153
-
154
-
155
-
156
-
157
-
158
-
159
-
160
-
161
-
162
-
163
-
164
-
165
-
166
-
167
-
168
-
169
-
170
-
171
-
172
-
173
-
174
-
175
-
176
-
177
-
178
-
179
-
180
-
181
-
182
-
183
-
184
-
185
-
186
-
187
-
188
-
189
-
190
-
191
-
192
-
193
-
194
-
195
-
196
-
197
-
198
-
199
-
200
-
201
-
202
-
203
-
204
-
205
-
206
-
207
-
208
-
209
-
210
-
211
-
212
-
213
-
214
-
215
-
216
-
217
-
218
-
219
-
 220
220 -
 221
221 -
 222
222 -
 223
223 -
 224
224 -
 225
225 -
 226
226 -
 227
227 -
 228
228 -
 229
229 -
 230
230 -
 231
231 -
 232
232 -
 233
233 -
 234
234 -
 235
235 -
 236
236 -
 237
237 -
 238
238 -
 239
239 -
 240
240 -
241
-
242
-
243
-
244
-
245
-
246
-
247
-
248
-
249
-
250
-
251
-
252
-
253
-
254
-
255
-
256
-
257
-
258
-
259
-
260
-
261
-
262
-
263
-
264
-
265
-
266
-
267
-
268
-
269
-
270
-
271
-
272
-
273
-
274
-
275
-
276
 |
 |

The discounted future cash-flows have been estimated using various
valuation techniques including multiplier calculations (‘EBITDA
multiples’), calculations based on the share price performance of a
peer group of listed (semiconductor) companies and discounted
cash-flow models based on unobservable inputs. The latter
methodology involved estimates of revenues, expenses, capital
spending and other costs, as well as a discount rate calculated based
on the risk profile of the semiconductor industry. Taking into account
certain market considerations and the range of estimated fair values,
management determined that the best estimate of future cash-flows
for the NXP investment was EUR 255 million at December 31, 2008.
However, the resulting estimated discounted cash-flow amount used
for impairment purposes represents an estimate; the actual cash-flows
of this interest could materially differ from that estimate.
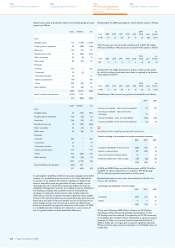
Another significant cost-method investment is that in TPO Displays
Corp. (TPO). The Company obtained a 17.4% stake in TPO after the
merger of MDS with TPO in 2006. The value of the investment
at
amortized cost is EUR 32 million, net of impairments. The Company
performed impairment reviews of the TPO investment, which resulted
in an impairment charge of EUR 71 million in 2008 and EUR 77 million
in 2006, recognized in Financial income and expense. The impairment
review in 2008 was triggered by the deteriorating economic environment
of the connected displays industry and the weakening financial
performance of TPO. The valuation was based on the ‘over-the-counter’
stock price of TPO, quoted on the Gre Tai Securities Market in
Taiwan, a market with insufficient trading volumes and infrequent
transactions.
Other
Included in the category
‘
other
’
are two convertible bonds, one issued
by TPV Technology (TPV) and one issued by CBAY.
The convertible bond issued by TPV has a total fair value of EUR 142
million as at December 31, 2008. The bond has a maturity date of
September 5, 2010, with an option to convert the bond into shares
of TPV during the period September 5, 2008 until maturity.
The CBAY convertible bond, which may not be transferred to a third
party before August 6, 2009, has a total fair value EUR 51 million as at
December 31, 2008. The bond has a maturity date of August 6, 2015.
Philips has an option to convert the bond into shares of CBAY before
the maturity date or to sell the convertible bond to CBAY as of
August 2012 onwards. CBAY also has options to redeem the convertible
bonds in 2011, 2012 and 2013 at a certain percentage of the bond’s
face value.
49
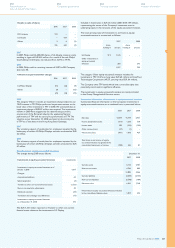
Non-current receivables
Non-current receivables include receivables with a remaining term of
more than one year, and the non-current portion of income taxes
receivable amounting to EUR 1 million (2007: EUR 14 million).
50
Other non-current assets
Other non-current assets in 2008 are comprised of prepaid pension
costs of EUR 1,858 million (2007: EUR 2,558 million) and prepaid
expenses of EUR 48 million (2007: EUR 52 million).
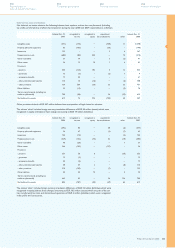
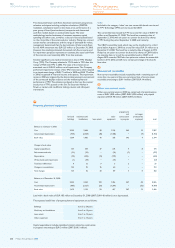
51
Property, plant and equipment
land and
buildings
machinery and
installations lease assets
other
equipment
prepayments
and
construction
in progress
no longer
productively
employed total
Balance as of January 1, 2008:
Cost 2,303 3,404 88 1,746 343 13 7,897
Accumulated depreciation (934) (2,324) (48) (1,388) −(9) (4,703)
Book value 1,369 1,080 40 358 343 4 3,194
Change in book value:
Capital expenditures 101 339 37 276 9 8 770
Retirements and sales (51) (33) −(36) (7) −(127)
Depreciation (90) (332) (13) (197) −−(632)
Write-downs and impairments (1) (39) −(17) −−(57)
Translation differences 9 12932−35
Changes in consolidation 133 95 25 60 −−313
Total changes 101 42 58 89 4 8 302
Balance as of December 31, 2008:
Cost 2,353 3,443 128 1,746 347 48 8,065
Accumulated depreciation (883) (2,321) (30) (1,299) −(36) (4,569)
Book value 1,470 1,122 98 447 347 12 3,496
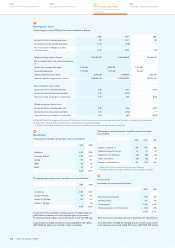
Land with a book value of EUR 185 million at December 31, 2008 (2007: EUR 148 million) is not depreciated.
The expected useful lives of property, plant and equipment are as follows:
Buildings from 5 to 50 years
Machinery and installations from 3 to 10 years
Lease assets from 1 to 15 years
Other equipment from 1 to 10 years
Capital expenditures include capitalized interest related to construction
in progress amounting to EUR 3 million (2007: EUR 5 million).
Philips Annual Report 2008230
180
Sustainability performance
244
Company financial statements
124
US GAAP financial statements
192
IFRS financial statements
Notes to the IFRS financial
statements