Philips 2008 Annual Report Download - page 267
Download and view the complete annual report
Please find page 267 of the 2008 Philips annual report below. You can navigate through the pages in the report by either clicking on the pages listed below, or by using the keyword search tool below to find specific information within the annual report.-
 1
1 -
2
-
3
-
4
-
5
-
6
-
7
-
8
-
9
-
10
-
11
-
12
-
13
-
14
-
15
-
16
-
17
-
18
-
19
-
20
-
21
-
22
-
23
-
24
-
25
-
26
-
27
-
28
-
29
-
30
-
31
-
32
-
33
-
34
-
35
-
36
-
37
-
38
-
39
-
40
-
41
-
42
-
43
-
44
-
45
-
46
-
47
-
48
-
49
-
50
-
51
-
52
-
53
-
54
-
55
-
56
-
57
-
58
-
59
-
60
-
61
-
62
-
63
-
64
-
65
-
66
-
67
-
68
-
69
-
70
-
71
-
72
-
73
-
74
-
75
-
76
-
77
-
78
-
79
-
80
-
81
-
82
-
83
-
84
-
85
-
86
-
87
-
88
-
89
-
90
-
91
-
92
-
93
-
94
-
95
-
96
-
97
-
98
-
99
-
100
-
101
-
102
-
103
-
104
-
105
-
106
-
107
-
108
-
109
-
110
-
111
-
112
-
113
-
114
-
115
-
116
-
117
-
118
-
119
-
120
-
121
-
122
-
123
-
124
-
125
-
126
-
127
-
128
-
129
-
130
-
131
-
132
-
133
-
134
-
135
-
136
-
137
-
138
-
139
-
140
-
141
-
142
-
143
-
144
-
145
-
146
-
147
-
148
-
149
-
150
-
151
-
152
-
153
-
154
-
155
-
156
-
157
-
158
-
159
-
160
-
161
-
162
-
163
-
164
-
165
-
166
-
167
-
168
-
169
-
170
-
171
-
172
-
173
-
174
-
175
-
176
-
177
-
178
-
179
-
180
-
181
-
182
-
183
-
184
-
185
-
186
-
187
-
188
-
189
-
190
-
191
-
192
-
193
-
194
-
195
-
196
-
197
-
198
-
199
-
200
-
201
-
202
-
203
-
204
-
205
-
206
-
207
-
208
-
209
-
210
-
211
-
212
-
213
-
214
-
215
-
216
-
217
-
218
-
219
-
220
-
221
-
222
-
223
-
224
-
225
-
226
-
227
-
228
-
229
-
230
-
231
-
232
-
233
-
234
-
235
-
236
-
237
-
238
-
239
-
240
-
241
-
242
-
243
-
244
-
245
-
246
-
247
-
248
-
249
-
250
-
251
-
252
-
253
-
254
-
255
-
256
-
 257
257 -
 258
258 -
 259
259 -
 260
260 -
 261
261 -
 262
262 -
 263
263 -
 264
264 -
 265
265 -
 266
266 -
 267
267 -
 268
268 -
 269
269 -
 270
270 -
 271
271 -
 272
272 -
 273
273 -
 274
274 -
 275
275 -
 276
276
 |
 |

Investor
information
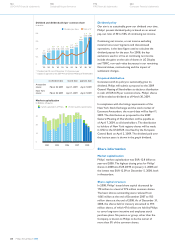
The year 2008
A challenging year in 2008
In common with many of our peers, the progressively
challenging economic environment has had an adverse
impact on our share price, on our 2008 financial
results and consequently on progress towards our
targets. Nevertheless, we have continued to execute
on all key strategic objectives – including the creation
of our Consumer Lifestyle sector, actions to improve
margins in our Television business, the successful
integration of Genlyte and Respironics, the significant
increase in sales of energy-efficient lighting, including
LED solutions, and the repurchase of EUR 3.3 billion
of our own shares. During the second half of the year
we have taken proactive measures to address the
deteriorating market conditions. We increased our
focus on cash and risk management and accelerated
our restructuring and change programs, which meant
that we entered 2009 with a solid balance sheet.
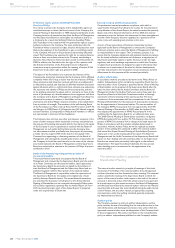
Net income and EPS
Net income of the Philips Group showed a loss of
EUR 186 million, or EUR 0.19 per common share,
compared to a profit of EUR 4,160 million, or
EUR 3.79 per common share, in 2007.
0
1,000
(1
,
000)
6,000
5,
000
4,00
0
3
,00
0
2,
00
0
in milli
o
n
s
o
f
eu
r
os
2004
1)
200
7
1)
200
5
1)
2006
1)
2008
Net income (loss)
net income net income per share in euros
2,835
2.21
2,861
2.28
5,381
4.55 4,160
3.79
(186)
(0.19)
EBIT
a
n
d
EBIT
A
2)
20041
)
20051
)
20061
)
2007
1)
2008
0
500
1
,
000
1,50
0
2,000
2
,50
0
1,643
1,549
1.31
1,383
1,198
1.17
2,054
1,841
1.87
931
317
0.93
1,836
1.43
1,731
in millions of euros
EBITA EBIT EBITA per share in euros - diluted
2,000
1,000
0
(1,000)
779
648
821
1,392
1,147
(613)
330
1,519
773
1,495
(252)
(444)
(358)
2.9
3.1
2.5
(1.3)
3.2
(499) (688) (698) (722)
Operating cash flows
in millions of euros
2004 2005 2006 2007 2008
operating cash flowsfree cash flows2)
net capital expenditure
free cash flows as a % of sales
Revised to reflect immaterial adjustments of intercompany profit
1)
eliminations on inventories
For a reconciliation to the most directly comparable US GAAP measures,
2)
see the chapter Reconciliation of non-US GAAP information
Philips Annual Report 2008 267
254
Corporate governance
250
Reconciliation of
non-US GAAP information
262
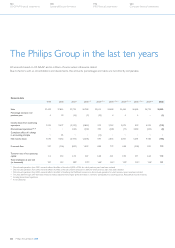
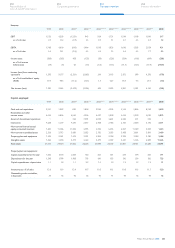
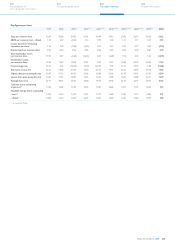
Ten-year overview
266
Investor information