Philips 2008 Annual Report Download - page 89
Download and view the complete annual report
Please find page 89 of the 2008 Philips annual report below. You can navigate through the pages in the report by either clicking on the pages listed below, or by using the keyword search tool below to find specific information within the annual report.-
 1
1 -
2
-
3
-
4
-
5
-
6
-
7
-
8
-
9
-
10
-
11
-
12
-
13
-
14
-
15
-
16
-
17
-
18
-
19
-
20
-
21
-
22
-
23
-
24
-
25
-
26
-
27
-
28
-
29
-
30
-
31
-
32
-
33
-
34
-
35
-
36
-
37
-
38
-
39
-
40
-
41
-
42
-
43
-
44
-
45
-
46
-
47
-
48
-
49
-
50
-
51
-
52
-
53
-
54
-
55
-
56
-
57
-
58
-
59
-
60
-
61
-
62
-
63
-
64
-
65
-
66
-
67
-
68
-
69
-
70
-
71
-
72
-
73
-
74
-
75
-
76
-
77
-
78
-
 79
79 -
 80
80 -
 81
81 -
 82
82 -
 83
83 -
 84
84 -
 85
85 -
 86
86 -
 87
87 -
 88
88 -
 89
89 -
 90
90 -
 91
91 -
 92
92 -
 93
93 -
 94
94 -
 95
95 -
 96
96 -
 97
97 -
 98
98 -
 99
99 -
100
-
101
-
102
-
103
-
104
-
105
-
106
-
107
-
108
-
109
-
110
-
111
-
112
-
113
-
114
-
115
-
116
-
117
-
118
-
119
-
120
-
121
-
122
-
123
-
124
-
125
-
126
-
127
-
128
-
129
-
130
-
131
-
132
-
133
-
134
-
135
-
136
-
137
-
138
-
139
-
140
-
141
-
142
-
143
-
144
-
145
-
146
-
147
-
148
-
149
-
150
-
151
-
152
-
153
-
154
-
155
-
156
-
157
-
158
-
159
-
160
-
161
-
162
-
163
-
164
-
165
-
166
-
167
-
168
-
169
-
170
-
171
-
172
-
173
-
174
-
175
-
176
-
177
-
178
-
179
-
180
-
181
-
182
-
183
-
184
-
185
-
186
-
187
-
188
-
189
-
190
-
191
-
192
-
193
-
194
-
195
-
196
-
197
-
198
-
199
-
200
-
201
-
202
-
203
-
204
-
205
-
206
-
207
-
208
-
209
-
210
-
211
-
212
-
213
-
214
-
215
-
216
-
217
-
218
-
219
-
220
-
221
-
222
-
223
-
224
-
225
-
226
-
227
-
228
-
229
-
230
-
231
-
232
-
233
-
234
-
235
-
236
-
237
-
238
-
239
-
240
-
241
-
242
-
243
-
244
-
245
-
246
-
247
-
248
-
249
-
250
-
251
-
252
-
253
-
254
-
255
-
256
-
257
-
258
-
259
-
260
-
261
-
262
-
263
-
264
-
265
-
266
-
267
-
268
-
269
-
270
-
271
-
272
-
273
-
274
-
275
-
276
 |
 |

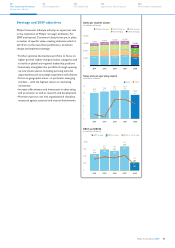
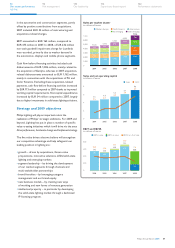
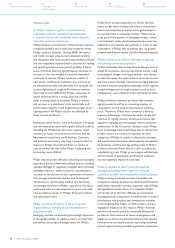
Sales per market cluster
in millions of euros
7,000
6,000
5,000
4,000
3,000
2,000
1,000
0
2004 2005 2006 2007 2008
Western Europe North America other mature
key emerging other emerging
1,773
4,526
1,828
4,775
2,022
5,466
2,436
6,093
2,560
564 652
835
1,012
1,084
845 941
1,072
1,216
1,255
1,051 1,057 1,194 1,125
1,936
7,106
271
293 297 343 304
Sales and net operating capital
in billions of euros
Sales NOC
8
6
4
2
0
4.5
1.5
2004
4.8
2.5
2005
5.5
2.5
2006
6.1
3.9
2007
7.1
5.6
2008
EBIT
a
n
d
EBIT
A
in millions of euro
s
2004 2005 2006 2007 2008
EBITA in valueEBIT in value EBITA as a % of sales
508
499
10.6 608
577
11.1 722
675
11.9
165
542
12.0
541
0
2
00
400
6
00
800
538
7.6
in the automotive and construction segments, partly
offset by positive contributions from acquisitions.
2007 included EUR 55 million of restructuring and
acquisition-related charges.
EBIT amounted to EUR 165 million, compared to
EUR 675 million in 2007. In 2008, a EUR 232 million
non-cash goodwill impairment charge for Lumileds
was recorded, primarily due to weaker demand in
the automotive, displays and mobile phone segments.
Cash flow before financing activities included cash
disbursements of EUR 1,826 million, mainly related to
the acquisition of Genlyte, whereas in 2007 acquisition-
related disbursements amounted to EUR 1,162 million,
mainly in connection with the acquisitions of PLI and
Color Kinetics. Excluding these acquisition-related
payments, cash flow before financing activities increased
by EUR 173 million compared to 2007 thanks to improved
working capital requirements. Net capital expenditures
increased by EUR 54 million compared to 2007, largely
due to higher investments in solid-state lighting solutions.
Strategy and 2009 objectives
Philips Lighting will play an important role in the
realization
of Philips’ strategic ambitions. For 2009 and
beyond, Lighting has put in place a number of specific
value-creating initiatives which it will drive via the axes
Drive performance, Accelerate change and Implement strategy.
The five value drivers that we believe will strengthen
our competitive advantage and help safeguard our
leading position in lighting are:
growth – driven by acquisitions, Green value
•
propositions, innovative solutions, LEDs/solid-state
lighting and emerging markets
segment leadership – by driving the development •
of our market segments through channels and
multi-stakeholder partnerships
brand franchise – by leveraging category •
management and our brand equity
new business models – by creating new ways •
of working and new forms of revenue generation
intellectual property – in particular by developing •
the solid-state lighting market through a dedicated
IP licensing program.
Philips Annual Report 2008 89
122
Performance statements
114
Supervisory Board report
110
Our leadership
94
Risk management
70
Our sector performance
Lighting