Philips 2008 Annual Report Download - page 172
Download and view the complete annual report
Please find page 172 of the 2008 Philips annual report below. You can navigate through the pages in the report by either clicking on the pages listed below, or by using the keyword search tool below to find specific information within the annual report.-
 1
1 -
2
-
3
-
4
-
5
-
6
-
7
-
8
-
9
-
10
-
11
-
12
-
13
-
14
-
15
-
16
-
17
-
18
-
19
-
20
-
21
-
22
-
23
-
24
-
25
-
26
-
27
-
28
-
29
-
30
-
31
-
32
-
33
-
34
-
35
-
36
-
37
-
38
-
39
-
40
-
41
-
42
-
43
-
44
-
45
-
46
-
47
-
48
-
49
-
50
-
51
-
52
-
53
-
54
-
55
-
56
-
57
-
58
-
59
-
60
-
61
-
62
-
63
-
64
-
65
-
66
-
67
-
68
-
69
-
70
-
71
-
72
-
73
-
74
-
75
-
76
-
77
-
78
-
79
-
80
-
81
-
82
-
83
-
84
-
85
-
86
-
87
-
88
-
89
-
90
-
91
-
92
-
93
-
94
-
95
-
96
-
97
-
98
-
99
-
100
-
101
-
102
-
103
-
104
-
105
-
106
-
107
-
108
-
109
-
110
-
111
-
112
-
113
-
114
-
115
-
116
-
117
-
118
-
119
-
120
-
121
-
122
-
123
-
124
-
125
-
126
-
127
-
128
-
129
-
130
-
131
-
132
-
133
-
134
-
135
-
136
-
137
-
138
-
139
-
140
-
141
-
142
-
143
-
144
-
145
-
146
-
147
-
148
-
149
-
150
-
151
-
152
-
153
-
154
-
155
-
156
-
157
-
158
-
159
-
160
-
161
-
 162
162 -
 163
163 -
 164
164 -
 165
165 -
 166
166 -
 167
167 -
 168
168 -
 169
169 -
 170
170 -
 171
171 -
 172
172 -
 173
173 -
 174
174 -
 175
175 -
 176
176 -
 177
177 -
 178
178 -
 179
179 -
 180
180 -
 181
181 -
 182
182 -
183
-
184
-
185
-
186
-
187
-
188
-
189
-
190
-
191
-
192
-
193
-
194
-
195
-
196
-
197
-
198
-
199
-
200
-
201
-
202
-
203
-
204
-
205
-
206
-
207
-
208
-
209
-
210
-
211
-
212
-
213
-
214
-
215
-
216
-
217
-
218
-
219
-
220
-
221
-
222
-
223
-
224
-
225
-
226
-
227
-
228
-
229
-
230
-
231
-
232
-
233
-
234
-
235
-
236
-
237
-
238
-
239
-
240
-
241
-
242
-
243
-
244
-
245
-
246
-
247
-
248
-
249
-
250
-
251
-
252
-
253
-
254
-
255
-
256
-
257
-
258
-
259
-
260
-
261
-
262
-
263
-
264
-
265
-
266
-
267
-
268
-
269
-
270
-
271
-
272
-
273
-
274
-
275
-
276
 |
 |

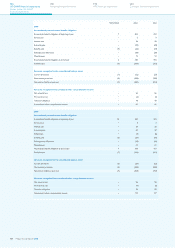
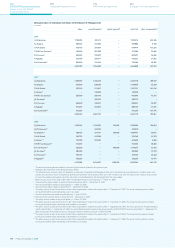
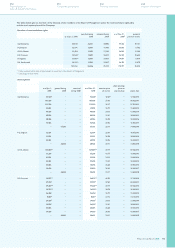
The following tables summarize information about Philips stock options as of December 31, 2008 and changes
during the year:
Option plans, EUR-denominated
shares
weighted average
exercise price
weighted average
remaining contractual
term (in years)
aggregate intrinsic
value (in millions)
Outstanding at January 1, 2008 34,089,540 30.14
Granted 5,747,981 23.42
Exercised 285,628 19.23
Forfeited 2,896,715 33.08
Expired −−
Outstanding at December 31, 2008 36,655,178 28.94 5.2 −
Exercisable at December 31, 2008 23,511,926 30.35 3.4 −
The exercise prices range from EUR 15.28 to 53.75
The weighted average grant-date fair value of options granted during 2008, 2007, and 2006 was EUR 5.69,
EUR 8.72 and EUR 9.76, respectively. The total intrinsic value of options exercised during 2008, 2007, and
2006 was EUR 1 million, EUR 16 million and EUR 8 million, respectively.
Option plans, USD-denominated
shares
weighted average
exercise price
weighted average
remaining contractual
term (in years)
aggregate intrinsic
value (in millions)
Outstanding at January 1, 2008 18,774,719 31.82
Granted 4,231,921 35.47
Exercised 1,075,063 25.15
Forfeited 884,967 35.97
Expired 42,600 18.14
Outstanding at December 31, 2008 21,004,010 32.75 5.7 2
Exercisable at December 31, 2008 11,634,946 29.71 3.4 2
The exercise prices range from USD 16.41 to 49.71
The weighted average grant-date fair value of options granted during 2008, 2007 and 2006 was USD 7.97,
USD 11.99 and USD 12.31, respectively. The total intrinsic value of options exercised during 2008, 2007
and 2006 was USD 13 million, USD 64 million and USD 46 million, respectively.
The aggregate intrinsic value in the tables above represents the total pretax intrinsic value (the difference
between the Company’s closing stock price on the last trading day of 2008 and the exercise price, multiplied
by the number of in-the-money options) that would have been received by the option holders if the options
had been exercised on December 31, 2008. At December 31, 2008, a total of EUR 68 million of unrecognized
compensation cost related to non-vested stock options. This cost is expected to be recognized over a
weighted-average period of 1.8 years. Cash received from option exercises under the Company’s option plans
amounted to EUR 24 million, EUR 140 million and EUR 120 million in 2008, 2007, and 2006, respectively. The
actual tax deductions realized as a result of stock option exercises totaled EUR 3 million, EUR 36 million and
EUR 16 million, in 2008, 2007, and 2006, respectively.
Philips Annual Report 2008172
180
Sustainability performance
192
IFRS financial statements
244
Company financial statements
124
US GAAP financial statements
Notes to the US GAAP
financial statements