Philips 2008 Annual Report Download - page 264
Download and view the complete annual report
Please find page 264 of the 2008 Philips annual report below. You can navigate through the pages in the report by either clicking on the pages listed below, or by using the keyword search tool below to find specific information within the annual report.-
 1
1 -
2
-
3
-
4
-
5
-
6
-
7
-
8
-
9
-
10
-
11
-
12
-
13
-
14
-
15
-
16
-
17
-
18
-
19
-
20
-
21
-
22
-
23
-
24
-
25
-
26
-
27
-
28
-
29
-
30
-
31
-
32
-
33
-
34
-
35
-
36
-
37
-
38
-
39
-
40
-
41
-
42
-
43
-
44
-
45
-
46
-
47
-
48
-
49
-
50
-
51
-
52
-
53
-
54
-
55
-
56
-
57
-
58
-
59
-
60
-
61
-
62
-
63
-
64
-
65
-
66
-
67
-
68
-
69
-
70
-
71
-
72
-
73
-
74
-
75
-
76
-
77
-
78
-
79
-
80
-
81
-
82
-
83
-
84
-
85
-
86
-
87
-
88
-
89
-
90
-
91
-
92
-
93
-
94
-
95
-
96
-
97
-
98
-
99
-
100
-
101
-
102
-
103
-
104
-
105
-
106
-
107
-
108
-
109
-
110
-
111
-
112
-
113
-
114
-
115
-
116
-
117
-
118
-
119
-
120
-
121
-
122
-
123
-
124
-
125
-
126
-
127
-
128
-
129
-
130
-
131
-
132
-
133
-
134
-
135
-
136
-
137
-
138
-
139
-
140
-
141
-
142
-
143
-
144
-
145
-
146
-
147
-
148
-
149
-
150
-
151
-
152
-
153
-
154
-
155
-
156
-
157
-
158
-
159
-
160
-
161
-
162
-
163
-
164
-
165
-
166
-
167
-
168
-
169
-
170
-
171
-
172
-
173
-
174
-
175
-
176
-
177
-
178
-
179
-
180
-
181
-
182
-
183
-
184
-
185
-
186
-
187
-
188
-
189
-
190
-
191
-
192
-
193
-
194
-
195
-
196
-
197
-
198
-
199
-
200
-
201
-
202
-
203
-
204
-
205
-
206
-
207
-
208
-
209
-
210
-
211
-
212
-
213
-
214
-
215
-
216
-
217
-
218
-
219
-
220
-
221
-
222
-
223
-
224
-
225
-
226
-
227
-
228
-
229
-
230
-
231
-
232
-
233
-
234
-
235
-
236
-
237
-
238
-
239
-
240
-
241
-
242
-
243
-
244
-
245
-
246
-
247
-
248
-
249
-
250
-
251
-
252
-
253
-
 254
254 -
 255
255 -
 256
256 -
 257
257 -
 258
258 -
 259
259 -
 260
260 -
 261
261 -
 262
262 -
 263
263 -
 264
264 -
 265
265 -
 266
266 -
 267
267 -
 268
268 -
 269
269 -
 270
270 -
 271
271 -
 272
272 -
 273
273 -
 274
274 -
275
-
276
 |
 |

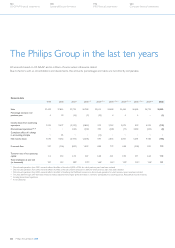
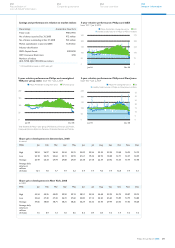
Financial structure
1999 2000 20011) 20021) 2) 20031) 2) 3) 20041) 2) 3) 4) 20051) 2) 3) 4) 20061) 2) 3) 4) 20073) 4) 2008
Other liabilities 8,262 8,764 8,047 6,854 6,292 7,142 8,433 8,129 7,799 8,625
Liabilities of discontinued operations
−−196 1,166 1,345 1,529 1,627 169 157 −
Debt 3,314 4,027 7,866 7,109 5,876 4,513 4,487 3,869 3,557 4,158
Provisions 3,056 3,557 3,731 2,978 2,646 2,627 2,622 3,281 3,089 3,969
Total provisions and liabilities 14,632 16,348 19,840 18,107 16,159 15,811 17,169 15,448 14,602 16,752
Minority interests 333 469 202 179 67 59 58 40 42 46
Stockholders’ equity 16,708 22,707 19,160 13,919 12,763 14,835 16,634 22,963 21,642 16,243
Total equity and liabilities 31,673 39,524 39,202 32,205 28,989 30,705 33,861 38,451 36,286 33,041
Net debt : group equity ratio 5:95 11:89 26:74 27:73 19:81 2:98 (4):104 (10):110 (32):132 3:97
Market capitalization at year-end 44,942 50,098 42,532 21,309 29,648 25,003 31,536 31,624 31,436 12,765
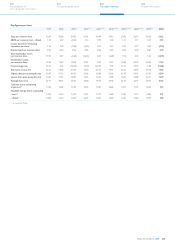
Sustainability
1999 2000 2001 2002 2003 2004 2005 2006 2007 2008
Green Product sales,
as a % of total sales −−−−−−−15.0 19.8 22.6
Green Innovation spending,
in millions of euros −−−−−−−−−282
Operational carbon footprint,
in kilotons CO2-e −−−−−−−−2,127 2,147
Energy consumption, in TJ
6) −−−−−−16,537 15,213 15,169 14,584
CO
2
emissions in manufacturing,
in kilotons CO
2
-e
6
)
−−−−−−1,059 868 855 825
Water intake, in thousands m3 6) −−−−−−5,398 4,171 4,209 3,966
Total waste, in kilotons
6) −−−−−−133.0 125.4 127.7 113.4
ISO 14001 certification %
6) −−−−−−93 93 90 95
Engagement Index, % positive score −−−−−−59 61 64 69
Female executives, in % of total −−−−−−56810
Lost Workday Injuries, per 100 FTEs
−−−−−−0.78 0.78 0.81 0.68
Philips Annual Report 2008264
180
Sustainability performance
192
IFRS financial statements
244
Company financial statements
124
US GAAP financial statements