Philips 2008 Annual Report Download - page 229
Download and view the complete annual report
Please find page 229 of the 2008 Philips annual report below. You can navigate through the pages in the report by either clicking on the pages listed below, or by using the keyword search tool below to find specific information within the annual report.-
 1
1 -
2
-
3
-
4
-
5
-
6
-
7
-
8
-
9
-
10
-
11
-
12
-
13
-
14
-
15
-
16
-
17
-
18
-
19
-
20
-
21
-
22
-
23
-
24
-
25
-
26
-
27
-
28
-
29
-
30
-
31
-
32
-
33
-
34
-
35
-
36
-
37
-
38
-
39
-
40
-
41
-
42
-
43
-
44
-
45
-
46
-
47
-
48
-
49
-
50
-
51
-
52
-
53
-
54
-
55
-
56
-
57
-
58
-
59
-
60
-
61
-
62
-
63
-
64
-
65
-
66
-
67
-
68
-
69
-
70
-
71
-
72
-
73
-
74
-
75
-
76
-
77
-
78
-
79
-
80
-
81
-
82
-
83
-
84
-
85
-
86
-
87
-
88
-
89
-
90
-
91
-
92
-
93
-
94
-
95
-
96
-
97
-
98
-
99
-
100
-
101
-
102
-
103
-
104
-
105
-
106
-
107
-
108
-
109
-
110
-
111
-
112
-
113
-
114
-
115
-
116
-
117
-
118
-
119
-
120
-
121
-
122
-
123
-
124
-
125
-
126
-
127
-
128
-
129
-
130
-
131
-
132
-
133
-
134
-
135
-
136
-
137
-
138
-
139
-
140
-
141
-
142
-
143
-
144
-
145
-
146
-
147
-
148
-
149
-
150
-
151
-
152
-
153
-
154
-
155
-
156
-
157
-
158
-
159
-
160
-
161
-
162
-
163
-
164
-
165
-
166
-
167
-
168
-
169
-
170
-
171
-
172
-
173
-
174
-
175
-
176
-
177
-
178
-
179
-
180
-
181
-
182
-
183
-
184
-
185
-
186
-
187
-
188
-
189
-
190
-
191
-
192
-
193
-
194
-
195
-
196
-
197
-
198
-
199
-
200
-
201
-
202
-
203
-
204
-
205
-
206
-
207
-
208
-
209
-
210
-
211
-
212
-
213
-
214
-
215
-
216
-
217
-
218
-
 219
219 -
 220
220 -
 221
221 -
 222
222 -
 223
223 -
 224
224 -
 225
225 -
 226
226 -
 227
227 -
 228
228 -
 229
229 -
 230
230 -
 231
231 -
 232
232 -
 233
233 -
 234
234 -
 235
235 -
 236
236 -
 237
237 -
 238
238 -
 239
239 -
240
-
241
-
242
-
243
-
244
-
245
-
246
-
247
-
248
-
249
-
250
-
251
-
252
-
253
-
254
-
255
-
256
-
257
-
258
-
259
-
260
-
261
-
262
-
263
-
264
-
265
-
266
-
267
-
268
-
269
-
270
-
271
-
272
-
273
-
274
-
275
-
276
 |
 |

44
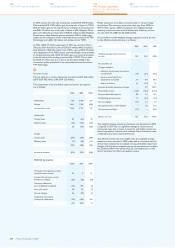
As discussed under Significant accounting policies , Reclassification
and revisions, the previously reported inventories balance as of
December 31, 2007 was adjusted downwards by EUR 57 million
to correct intercompany profit eliminations.
47
Other current assets
Other current assets include assets for derivative financial instruments
of
EUR 253 million (2007: EUR 275 million), prepaid expenses of
EUR 375
million (2007: EUR 347 million) and other current financial
assets of EUR 121 million (2007: EUR nil).
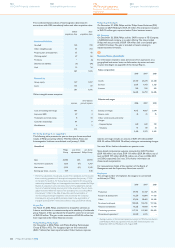
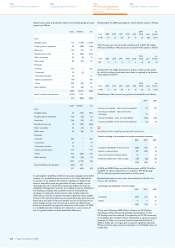
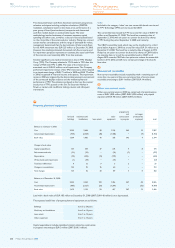
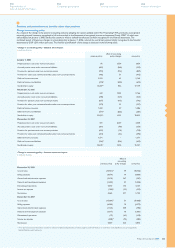
48
Other non-current financial assets
The changes during 2008 are as follows:
available-
for-sale
securities
restricted
liquid
assets
cost-
method
invest-
ments other total
Balance as of
January 1, 2008 1,776 101 1,027 279 3,183
Changes:
Reclassifications 1,531 (27) (3) 24 1,525
Acquisitions/
additions 75 2 2 82 161
Sales/
redemptions/
reductions (2,530) −(2) (22) (2,554)
Value
adjustments/
impairments (253) −(673) (69) (995)
Translation and
exchange
differences −(1) −12 11
Balance as of
December 31,
2008 599 75 351 306 1,331
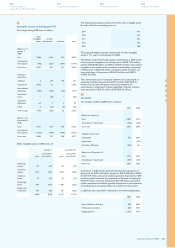
Investments in available-for-sale securities
The Company’s investments in available-for-sale securities consist
of investments in common stock of companies in various industries.
Major holdings in available-for-sale securities at December 31:
2007 2008
number of
shares fair value
number of
shares fair value
D&M
Holdings
Inc. 11,126,640 32 −−
TSMC 1,311,490,224 1,699 −−
LG Display −−47,225,000 558
Pace Micro
Technology
Plc. −−50,701,049 29
1,731 587
During 2008, the Company reduced its shareholding portfolio of
available-for-sale securities by selling its interests in TSMC and D&M
Holdings (D&M).
In 2007, Philips and TSMC jointly announced that the companies
agreed to a multi-phased plan to facilitate an orderly exit by Philips
from its shareholding in TSMC. The plan comprised a private sale
transaction to long-term financial investors in Taiwan, the offering of
shares through a public offering in the United States (in the form of
American Depositary Shares) and the participation in stock
repurchase programs initiated by TSMC. Under this agreement, the
47
48
45
remaining 1,311 million TSMC shares were sold during 2008 in various
transactions. Philips realized a gain of EUR 1,205 million on these
transactions. In September 2008, Philips sold its remaining stake of
approximately 13% in D&M, a Japanese company which manufactures
audio-visual products. The gain on this transaction was EUR 20 million.
The results on the TSMC and D&M transactions were recognized in
Financial income and expenses.
During 2008, the Company increased its shareholding portfolio of
available-for-sale securities, primarily as a result of the reclassification
of LG Display from Investments in equity-accounted investees.
Additionally shares of Pace Micro Technology (Pace) were received
in conjunction with the divesture of our Set-Top Boxes and
Connectivity Solutions activities.
Until March 2008, LG Display was presented as an equity-accounted
investee. At the end of February 2008, Philips’ influence on LG Display’s
operating and financial policies including representation on the LG
Display board, was reduced. Consequently, the 19.9% investment in
LG Display was transferred from investments in equity-accounted
investees to available-for-sale securities effective March 1, 2008, as
Philips was no longer able to exercise significant influence. The
investment in LG Display was reduced on March 12, 2008, when 24
million shares were sold in a capital market transaction to third
parties. The EUR 158 million gain on this transaction was presented
in Financial income and expense. At December 31, 2008, Philips owned
13.2% of LG Display’s share capital. At year-end the fair value based on
the stock price of LG Display was EUR 448 million below the
carrying value (fair value plus losses recognized in accumulated other
comprehensive income). As this loss was considered significant, an
impairment charge of EUR 448 million was recorded, by releasing
the accumulated amounts under Other comprehensive income to
Financial income and expense.
In April 2008, the Company obtained 64.5 million shares in Pace in
exchange for the transfer of the Company’s Set-Top Boxes and
Connectivity Solutions activities. Subsequently, 13.8 million shares
were sold to third parties. The EUR 1 million loss on this transaction
was presented under Financial income and expenses. As of December
31, 2008, Philips owns 17% of Pace’s share capital. At year-end the
fair value based on the stock price of Pace was EUR 30 million below
the carrying value (fair value plus losses recognized in accumulated
other comprehensive income). As this loss was considered significant,
an impairment charge of EUR 30 million was recorded, by releasing
the accumulated amounts under Other comprehensive income to
Financial income and expense.
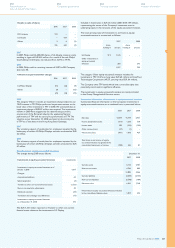
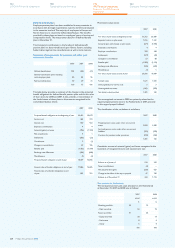
Cost-method investments
The major cost-method investment as of December 31, 2008 is NXP,
for an amount of EUR 255 million, of which the Company holds 19.8%
of the common shares. The interest in NXP resulted from the sale of
a majority stake in the Semiconductors division in September 2006.
The Company’s stake in NXP is considered a non-core activity that is
available for sale. Although the ultimate method of disposal and the
precise market for non-listed shares are not clear, the disposal could
be effected, for example, by way of a private transaction to strategic
buyers or other financial parties, or via a public offering. The Company
does not have any definitive plans to dispose of this interest.
NXP is a privately held company that is not quoted in an active
market. NXP is carried at cost because the fair value cannot be
reliably determined. The variability in the range of reasonable fair
value estimates is significant and the probabilities of the various
estimates within the range of reasonable inputs are not sufficiently
reliable to determine a fair value. This is mainly due to the nature of
the majority shareholders (private equity firms) and their potentially
volatile investment and exit strategy, as well as to the nature and
limited availability of the financial projections of NXP. Triggered by the
deteriorating economic environment of the semiconductors industry
in general and the weakening financial performance of NXP
specifically, Philips performed impairment reviews on the carrying
value of the investment in NXP in 2007 and 2008. During 2008,
impairment charges were recognized in the amount of EUR 599
million, which are presented in Financial income and expenses.
In accordance with IAS 39, Financial Instruments: Recognition and
Measurement, paragraph 66, if there is objective evidence that an
impairment loss has been incurred for an unquoted equity investment
carried at cost, the amount of the impairment loss is measured as the
difference between the carrying amount of the investment and the
present value of the estimated discounted future cash-flows.
46
Philips Annual Report 2008 229
254
Corporate governance
250
Reconciliation of
non-US GAAP information
262
Ten-year overview
266
Investor information