Philips 2008 Annual Report Download - page 158
Download and view the complete annual report
Please find page 158 of the 2008 Philips annual report below. You can navigate through the pages in the report by either clicking on the pages listed below, or by using the keyword search tool below to find specific information within the annual report.-
 1
1 -
2
-
3
-
4
-
5
-
6
-
7
-
8
-
9
-
10
-
11
-
12
-
13
-
14
-
15
-
16
-
17
-
18
-
19
-
20
-
21
-
22
-
23
-
24
-
25
-
26
-
27
-
28
-
29
-
30
-
31
-
32
-
33
-
34
-
35
-
36
-
37
-
38
-
39
-
40
-
41
-
42
-
43
-
44
-
45
-
46
-
47
-
48
-
49
-
50
-
51
-
52
-
53
-
54
-
55
-
56
-
57
-
58
-
59
-
60
-
61
-
62
-
63
-
64
-
65
-
66
-
67
-
68
-
69
-
70
-
71
-
72
-
73
-
74
-
75
-
76
-
77
-
78
-
79
-
80
-
81
-
82
-
83
-
84
-
85
-
86
-
87
-
88
-
89
-
90
-
91
-
92
-
93
-
94
-
95
-
96
-
97
-
98
-
99
-
100
-
101
-
102
-
103
-
104
-
105
-
106
-
107
-
108
-
109
-
110
-
111
-
112
-
113
-
114
-
115
-
116
-
117
-
118
-
119
-
120
-
121
-
122
-
123
-
124
-
125
-
126
-
127
-
128
-
129
-
130
-
131
-
132
-
133
-
134
-
135
-
136
-
137
-
138
-
139
-
140
-
141
-
142
-
143
-
144
-
145
-
146
-
147
-
 148
148 -
 149
149 -
 150
150 -
 151
151 -
 152
152 -
 153
153 -
 154
154 -
 155
155 -
 156
156 -
 157
157 -
 158
158 -
 159
159 -
 160
160 -
 161
161 -
 162
162 -
 163
163 -
 164
164 -
 165
165 -
 166
166 -
 167
167 -
 168
168 -
169
-
170
-
171
-
172
-
173
-
174
-
175
-
176
-
177
-
178
-
179
-
180
-
181
-
182
-
183
-
184
-
185
-
186
-
187
-
188
-
189
-
190
-
191
-
192
-
193
-
194
-
195
-
196
-
197
-
198
-
199
-
200
-
201
-
202
-
203
-
204
-
205
-
206
-
207
-
208
-
209
-
210
-
211
-
212
-
213
-
214
-
215
-
216
-
217
-
218
-
219
-
220
-
221
-
222
-
223
-
224
-
225
-
226
-
227
-
228
-
229
-
230
-
231
-
232
-
233
-
234
-
235
-
236
-
237
-
238
-
239
-
240
-
241
-
242
-
243
-
244
-
245
-
246
-
247
-
248
-
249
-
250
-
251
-
252
-
253
-
254
-
255
-
256
-
257
-
258
-
259
-
260
-
261
-
262
-
263
-
264
-
265
-
266
-
267
-
268
-
269
-
270
-
271
-
272
-
273
-
274
-
275
-
276
 |
 |

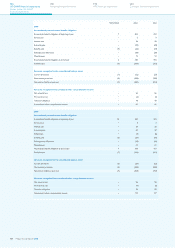
16
Intangible assets excluding goodwill
The changes during 2008 were as follows:
software
other
intangible
assets total
Balance as of
January 1, 2008:
Cost 615 2,629 3,244
Accumulated
amortization (404) (686) (1,090)
Book value 211 1,943 2,154
Changes in book value:
Acquisitions/additions 118 2,106 2,224
Amortization/deductions (85) (380) (465)
Translation differences 5 55 60
Other (6) 8 2
Total changes 32 1,789 1,821
Balance as of
December 31, 2008:
Cost 702 4,784 5,486
Accumulated
amortization (459) (1,052) (1,511)
Book value 243 3,732 3,975
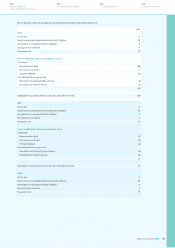
Other intangible assets in 2008 consist of:
January 1 December 31
gross
accumulated
amortization gross
accumulated
amortization
Marketing-
related 168 (30) 69 (24)
Customer-
related 1,042 (182) 2,527 (354)
Contract-
based 33 (10) 36 (17)
Technology-
based 735 (374) 1,356 (518)
Patents and
trademarks 651 (90) 796 (139)
2,629 (686) 4,784 (1,052)
The estimated amortization expense for these other intangible assets
for each of the five succeeding years is:
2009 391
2010 372
2011 334
2012 308
2013 279
The expected weighted average remaining life of other intangibles
is 11.5 years as of December 31, 2008.
The additions acquired through business combinations in 2008 consist
of the acquired intangible assets of Respironics of EUR 1,186 million,
Genlyte of EUR 860 million, and VISICU of EUR 33 million.
The acquired intangible assets mainly consist of customer relationships
and patents for Respironics of EUR 732 million and Genlyte of EUR 614
million, and core and existing technology for Respironics of EUR 355
million and VISICU of EUR 20 million.
The unamortized costs of computer software to be sold, leased or
otherwise marketed amounted to EUR 102 million (2007: EUR 63
million). The amounts charged to the income statement for amortization
or impairment of these capitalized computer software costs
amounted to EUR 26 million (2007: EUR 20 million).
17
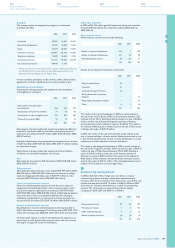
Goodwill
The changes in 2007 and 2008 were as follows:
2007 2008
Balance as of January 1:
Cost 3,853 4,249
Amortization / Impairments (130) (114)
Book value 3,723 4,135
Acquisitions 810 3,446
Impairments −(234)
Translation differences (398) 354
Balance as of December 31:
Cost 4,249 8,033
Amortization / Impairments (114) (332)
Book value 4,135 7,701
Acquisitions in 2008 include the goodwill paid on the acquisition of
Respironics for EUR 2,162 million, Genlyte for EUR 1,036 million, and
VISICU for EUR 175 million, and several smaller acquisitions.
Acquisitions in 2007 include the goodwill paid on the acquisition of
Partners in Lighting for EUR 297 million, Color Kinetics for EUR 357
million and several smaller acquisitions. In addition, goodwill changed
due to the finalization of purchase price accounting related to
acquisitions in prior years.
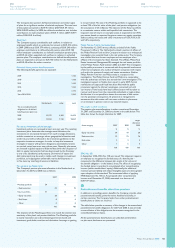
A significant part of goodwill is allocated to the following
reporting units:
2007 2008
Home Healthcare Solutions 388 2,800
Professional Luminaires 353 1,445
Imaging Systems 1,210 1,274
Home Healthcare Solutions and Professional Luminaires increased by
the acquisitions of Respironics and Genlyte, respectively (see note 2)
and are the most sensitive to fluctuations in the key assumptions used
in the impairment tests as set out below.
The key assumptions used in the annual (performed in Q2) and
trigger-based impairment tests were growth of sales and gross margin,
together with the rates used for discounting the forecast cash flows.
Sales and gross margin growth are based on management’s internal
forecasts that cover an initial period of no more than five years and
then are extrapolated with stable or declining growth rates, after
which a terminal value is calculated for which growth rates are
capped. The pre-tax discount rates are determined for each reporting
unit (one level below sector level) and, in the annual test, ranged from
9.4% to 15.6%.
Due to deteriorating economic circumstances and the decline of
the market capitalization of the Company, trigger-based impairment
tests were performed in the latter half of the year using updated
assumptions. The trigger-based tests resulted in goodwill impairment
charges of EUR 234 million, mainly related to Lumileds as a
Philips Annual Report 2008158
180
Sustainability performance
192
IFRS financial statements
244
Company financial statements
124
US GAAP financial statements
Notes to the US GAAP
financial statements