Philips 2008 Annual Report Download - page 271
Download and view the complete annual report
Please find page 271 of the 2008 Philips annual report below. You can navigate through the pages in the report by either clicking on the pages listed below, or by using the keyword search tool below to find specific information within the annual report.-
 1
1 -
2
-
3
-
4
-
5
-
6
-
7
-
8
-
9
-
10
-
11
-
12
-
13
-
14
-
15
-
16
-
17
-
18
-
19
-
20
-
21
-
22
-
23
-
24
-
25
-
26
-
27
-
28
-
29
-
30
-
31
-
32
-
33
-
34
-
35
-
36
-
37
-
38
-
39
-
40
-
41
-
42
-
43
-
44
-
45
-
46
-
47
-
48
-
49
-
50
-
51
-
52
-
53
-
54
-
55
-
56
-
57
-
58
-
59
-
60
-
61
-
62
-
63
-
64
-
65
-
66
-
67
-
68
-
69
-
70
-
71
-
72
-
73
-
74
-
75
-
76
-
77
-
78
-
79
-
80
-
81
-
82
-
83
-
84
-
85
-
86
-
87
-
88
-
89
-
90
-
91
-
92
-
93
-
94
-
95
-
96
-
97
-
98
-
99
-
100
-
101
-
102
-
103
-
104
-
105
-
106
-
107
-
108
-
109
-
110
-
111
-
112
-
113
-
114
-
115
-
116
-
117
-
118
-
119
-
120
-
121
-
122
-
123
-
124
-
125
-
126
-
127
-
128
-
129
-
130
-
131
-
132
-
133
-
134
-
135
-
136
-
137
-
138
-
139
-
140
-
141
-
142
-
143
-
144
-
145
-
146
-
147
-
148
-
149
-
150
-
151
-
152
-
153
-
154
-
155
-
156
-
157
-
158
-
159
-
160
-
161
-
162
-
163
-
164
-
165
-
166
-
167
-
168
-
169
-
170
-
171
-
172
-
173
-
174
-
175
-
176
-
177
-
178
-
179
-
180
-
181
-
182
-
183
-
184
-
185
-
186
-
187
-
188
-
189
-
190
-
191
-
192
-
193
-
194
-
195
-
196
-
197
-
198
-
199
-
200
-
201
-
202
-
203
-
204
-
205
-
206
-
207
-
208
-
209
-
210
-
211
-
212
-
213
-
214
-
215
-
216
-
217
-
218
-
219
-
220
-
221
-
222
-
223
-
224
-
225
-
226
-
227
-
228
-
229
-
230
-
231
-
232
-
233
-
234
-
235
-
236
-
237
-
238
-
239
-
240
-
241
-
242
-
243
-
244
-
245
-
246
-
247
-
248
-
249
-
250
-
251
-
252
-
253
-
254
-
255
-
256
-
257
-
258
-
259
-
260
-
 261
261 -
 262
262 -
 263
263 -
 264
264 -
 265
265 -
 266
266 -
 267
267 -
 268
268 -
 269
269 -
 270
270 -
 271
271 -
 272
272 -
 273
273 -
 274
274 -
 275
275 -
 276
276
 |
 |

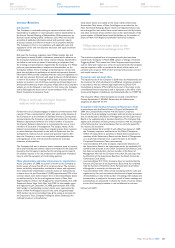
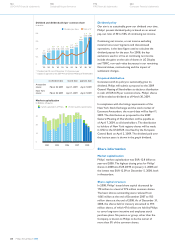
Listings and performance in relation to market indices
Share listings Amsterdam, New-York
Ticker code PHIA, PHG
No. of shares issued at Dec 31, 2008 972 million
No. of shares outstanding at Dec 31, 2008
923 million
Market capitalization at year-end 2008 12.8 billion
Industry classification
MSCI: Capital Goods 20105010
ICB1): Consumer Electronics 3743
Members of indices
AEX, NYSE, DJSI, STOXX50, and others
ICB classification based on 2007 sales split
1)
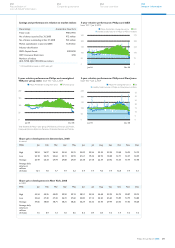
5-year relative performance: Philips and AEX
base 100 = Jan 2, 2004
Jan ‘04 Dec ‘08
AEXPhilips Amsterdam closing share price
monthly traded volume in Philips on AEX, in millions
0
100
50
200
150
250
0
150
75
300
225
375
5-year relative performance: Philips and Dow Jones
base 100 = Jan 2, 2004
DJPhilips NY closing share price
monthly traded volume in Philips on Dow Jones, in millions
0
100
50
200
150
250
0
15
20
5
10
30
25
35
Jan ‘04 Dec ‘08
5-year relative performance: Philips and unweighted
TSR peer group index base 100 = Jan 2, 2004
Jan ‘04 Dec ‘08
0
100
50
150
200
TSR peer groupPhilips Amsterdam closing share price
Share price development in Amsterdam, 2008
in euros
PHIA Jan Feb Mar Apr May Jun Jul Aug Sep Oct Nov Dec
High 28.94 26.97 26.24 25.24 25.31 25.00 22.36 23.33 22.94 19.68 16.02 14.19
Low 24.18 25.73 23.63 23.11 23.93 21.61 19.42 20.95 18.48 12.71 12.47 12.09
Average 26.49 26.33 24.94 24.88 24.59 23.38 21.18 22.39 20.92 15.35 13.79 13.48
Average daily
volume, in
millions
of shares 12.1 7.0 7.7 7.9 5.2 5.9 7.7 4.6 7.9 12.8 7.9 6.1
Share price development in New York, 2008
in USD
PHG Jan Feb Mar Apr May Jun Jul Aug Sep Oct Nov Dec
High 42.34 40.35 40.09 39.50 39.13 38.51 35.34 34.68 32.92 26.75 20.87 20.15
Low 35.64 37.30 37.43 36.31 37.60 33.80 31.13 32.20 25.60 15.89 14.79 14.88
Average 39.06 38.83 38.71 38.21 38.26 36.24 33.36 33.45 29.99 20.36 17.50 18.28
Average daily
volume, in
millions
of shares 1.5 0.9 1.3 1.0 0.6 0.6 0.9 0.5 1.0 1.4 1.0 1.0
Total Shareholder Return peer group: 3M, Electrolux, Emerson, GE, Hitachi,
Honeywell, Johnson & Johnson, Panasonic, Schneider, Siemens and Toshiba
Philips Annual Report 2008 271
254
Corporate governance
250
Reconciliation of
non-US GAAP information
262
Ten-year overview
266
Investor information