Philips 2008 Annual Report Download - page 107
Download and view the complete annual report
Please find page 107 of the 2008 Philips annual report below. You can navigate through the pages in the report by either clicking on the pages listed below, or by using the keyword search tool below to find specific information within the annual report.-
 1
1 -
2
-
3
-
4
-
5
-
6
-
7
-
8
-
9
-
10
-
11
-
12
-
13
-
14
-
15
-
16
-
17
-
18
-
19
-
20
-
21
-
22
-
23
-
24
-
25
-
26
-
27
-
28
-
29
-
30
-
31
-
32
-
33
-
34
-
35
-
36
-
37
-
38
-
39
-
40
-
41
-
42
-
43
-
44
-
45
-
46
-
47
-
48
-
49
-
50
-
51
-
52
-
53
-
54
-
55
-
56
-
57
-
58
-
59
-
60
-
61
-
62
-
63
-
64
-
65
-
66
-
67
-
68
-
69
-
70
-
71
-
72
-
73
-
74
-
75
-
76
-
77
-
78
-
79
-
80
-
81
-
82
-
83
-
84
-
85
-
86
-
87
-
88
-
89
-
90
-
91
-
92
-
93
-
94
-
95
-
96
-
 97
97 -
 98
98 -
 99
99 -
 100
100 -
 101
101 -
 102
102 -
 103
103 -
 104
104 -
 105
105 -
 106
106 -
 107
107 -
 108
108 -
 109
109 -
 110
110 -
 111
111 -
 112
112 -
 113
113 -
 114
114 -
 115
115 -
 116
116 -
 117
117 -
118
-
119
-
120
-
121
-
122
-
123
-
124
-
125
-
126
-
127
-
128
-
129
-
130
-
131
-
132
-
133
-
134
-
135
-
136
-
137
-
138
-
139
-
140
-
141
-
142
-
143
-
144
-
145
-
146
-
147
-
148
-
149
-
150
-
151
-
152
-
153
-
154
-
155
-
156
-
157
-
158
-
159
-
160
-
161
-
162
-
163
-
164
-
165
-
166
-
167
-
168
-
169
-
170
-
171
-
172
-
173
-
174
-
175
-
176
-
177
-
178
-
179
-
180
-
181
-
182
-
183
-
184
-
185
-
186
-
187
-
188
-
189
-
190
-
191
-
192
-
193
-
194
-
195
-
196
-
197
-
198
-
199
-
200
-
201
-
202
-
203
-
204
-
205
-
206
-
207
-
208
-
209
-
210
-
211
-
212
-
213
-
214
-
215
-
216
-
217
-
218
-
219
-
220
-
221
-
222
-
223
-
224
-
225
-
226
-
227
-
228
-
229
-
230
-
231
-
232
-
233
-
234
-
235
-
236
-
237
-
238
-
239
-
240
-
241
-
242
-
243
-
244
-
245
-
246
-
247
-
248
-
249
-
250
-
251
-
252
-
253
-
254
-
255
-
256
-
257
-
258
-
259
-
260
-
261
-
262
-
263
-
264
-
265
-
266
-
267
-
268
-
269
-
270
-
271
-
272
-
273
-
274
-
275
-
276
 |
 |

The aggregate Funded Status is least sensitive to
interest rate risk. This reflects the LDI strategies in
the Netherlands and the UK and the relatively large
fixed income allocations in Germany. The biggest
sensitivity to interest rates exists in the US plan. This
is attributable to the interest rate mismatch between
its assets and liabilities. The overall sensitivity to
longevity is comparable to the sensitivity to equity
prices. The Dutch fund contributes most, which is due
to its size.
The aggregate NPPC is particularly sensitive to
changes in interest rates and inflation expectations.
This can be explained by the interest and inflation
sensitivity of NPPC in the Netherlands. NPPC is less
sensitive to changes in equity valuations and longevity.
Due to its absolute exposure to equities, the biggest
sensitivity to equities still exists in the Netherlands.
The biggest sensitivity to longevity also exists in
the Netherlands.
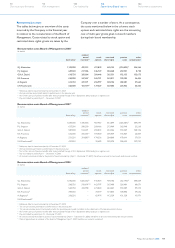
Stochastic analysis
The sensitivities described above reflect the
impacts of separate changes in equity prices, interest
rates, etc. As such changes are unlikely to happen
simultaneously, a simple summation of the above-
mentioned sensitivities would overestimate the
total risk exposure. The difference between the total
risk and that summation represents the so-called
diversification effect. It results from the less than
perfect (or even negative) correlation between the
respective risk factors. The diversification effect may
be captured by a stochastic analysis, i.e. by analyzing
the outcomes of a large number of simulations.
These simulations are based on the volatility of and
correlations between the respective risk factors
over the past 30 years. The bar charts on the right
show the maximum deviations from the expected
aggregate Funded Status as per year-end 2008 and
year-end 2009, and the expected NPPC for 2009 and
2010, if the 5% worst possible outcomes are excluded.
These “Funded-Status-at-Risk” and “NPPC-at-Risk”
measures are based on the valuations of plan assets
and liabilities on December 31, 2007 and December
31, 2008, respectively, and may therefore be seen as
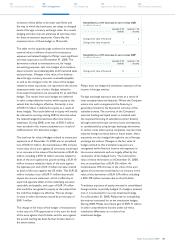
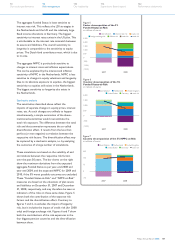
indicators of the risks on these same dates. Figure 5
shows both the contribution of the separate risk
factors and the diversification effect. Contrary to
figures 1 and 2, it excludes the impact of longevity
risk, but it includes the impact of credit risk (for 2008
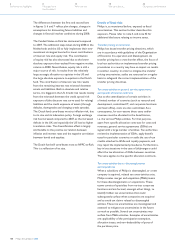
only) and foreign exchange risk. Figures 6 and 7 show
both the contributions of the risk exposures in the
four biggest pension countries and the diversification
between them.
Figure 5
Factor decomposition of the 5%
Funded-Status-at-Risk
in millions of euros
(
1,500
)
(
1,000
)
(
500
)
0
5
0
0
1
,
000
1
,5
00
2
,
000
2,
5
00
20082007
diversi
f
ication
t
ota
l
r
i
s
k
equ
i
ty r
i
s
k
i
nterest rate r
i
s
k
forei
g
n exchan
g
e ris
k
i
n
f
lation risk
c
redit ris
k
Figure 6
Country decomposition of the 5%
Funded-Status-at-Risk
in millions of euros
(1
,
000)
(
500
)
0
500
1,000
1
,5
00
2,
000
20082007
t
ota
l
r
i
s
k
d
iversi
f
icatio
n
United Kingdom
N
etherland
s
U
nited State
s
G
erman
y
Figure 7
Country decomposition of the 5% NPPC-at-Risk
in millions of euros
total
r
isk
20082007
diversi
f
ication United Kingdom
N
etherland
s
(
75
)
0
75
150
22
5
U
nited States
G
erman
y
Philips Annual Report 2008 107
122
Performance statements
114
Supervisory Board report
110
Our leadership
94
Risk management
70
Our sector performance