Philips 2008 Annual Report Download - page 228
Download and view the complete annual report
Please find page 228 of the 2008 Philips annual report below. You can navigate through the pages in the report by either clicking on the pages listed below, or by using the keyword search tool below to find specific information within the annual report.-
 1
1 -
2
-
3
-
4
-
5
-
6
-
7
-
8
-
9
-
10
-
11
-
12
-
13
-
14
-
15
-
16
-
17
-
18
-
19
-
20
-
21
-
22
-
23
-
24
-
25
-
26
-
27
-
28
-
29
-
30
-
31
-
32
-
33
-
34
-
35
-
36
-
37
-
38
-
39
-
40
-
41
-
42
-
43
-
44
-
45
-
46
-
47
-
48
-
49
-
50
-
51
-
52
-
53
-
54
-
55
-
56
-
57
-
58
-
59
-
60
-
61
-
62
-
63
-
64
-
65
-
66
-
67
-
68
-
69
-
70
-
71
-
72
-
73
-
74
-
75
-
76
-
77
-
78
-
79
-
80
-
81
-
82
-
83
-
84
-
85
-
86
-
87
-
88
-
89
-
90
-
91
-
92
-
93
-
94
-
95
-
96
-
97
-
98
-
99
-
100
-
101
-
102
-
103
-
104
-
105
-
106
-
107
-
108
-
109
-
110
-
111
-
112
-
113
-
114
-
115
-
116
-
117
-
118
-
119
-
120
-
121
-
122
-
123
-
124
-
125
-
126
-
127
-
128
-
129
-
130
-
131
-
132
-
133
-
134
-
135
-
136
-
137
-
138
-
139
-
140
-
141
-
142
-
143
-
144
-
145
-
146
-
147
-
148
-
149
-
150
-
151
-
152
-
153
-
154
-
155
-
156
-
157
-
158
-
159
-
160
-
161
-
162
-
163
-
164
-
165
-
166
-
167
-
168
-
169
-
170
-
171
-
172
-
173
-
174
-
175
-
176
-
177
-
178
-
179
-
180
-
181
-
182
-
183
-
184
-
185
-
186
-
187
-
188
-
189
-
190
-
191
-
192
-
193
-
194
-
195
-
196
-
197
-
198
-
199
-
200
-
201
-
202
-
203
-
204
-
205
-
206
-
207
-
208
-
209
-
210
-
211
-
212
-
213
-
214
-
215
-
216
-
217
-
 218
218 -
 219
219 -
 220
220 -
 221
221 -
 222
222 -
 223
223 -
 224
224 -
 225
225 -
 226
226 -
 227
227 -
 228
228 -
 229
229 -
 230
230 -
 231
231 -
 232
232 -
 233
233 -
 234
234 -
 235
235 -
 236
236 -
 237
237 -
 238
238 -
239
-
240
-
241
-
242
-
243
-
244
-
245
-
246
-
247
-
248
-
249
-
250
-
251
-
252
-
253
-
254
-
255
-
256
-
257
-
258
-
259
-
260
-
261
-
262
-
263
-
264
-
265
-
266
-
267
-
268
-
269
-
270
-
271
-
272
-
273
-
274
-
275
-
276
 |
 |

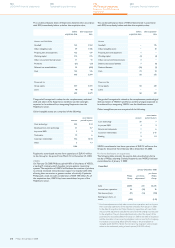
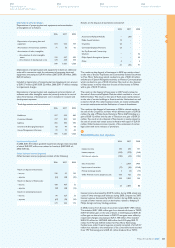
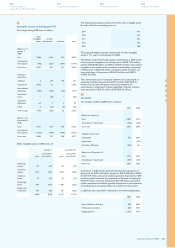
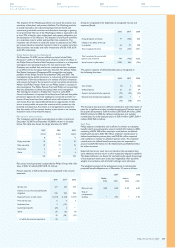
44
Earnings per share
The earnings per share (EPS) data have been calculated as follows:
2006 2007 2008
Income (loss) from continuing operations 999 5,011 (94)
Incom (loss) from discontinued operations 4,154 (138) 3
Net income (loss) attributable to holders
of common shares 5,153 4,873 (91)
Weighted average number of shares 1,174,924,579 1,086,128,418 991,420,017
Plus incremental shares from assumed conversions
of:
Options and restricted share rights 7,531,636 11,669,275 5,191,635
Convertible debentures 1,174,299 1,127,690 102,249
Dilutive potential common shares 8,705,935 12,796,965 5,293,884
Adjusted weighted average number of shares 1,183,630,514 1,098,925,383 996,713,901
Basic earnings per share in euros
Income (loss) from continuing operations 0.85 4.61 (0.09)
Income (loss) from discontinued operations 3.54 (0.12) −
Net income (loss) attributable to stockholders 4.39 4.49 (0.09)
Diluted earnings per share in euros
Income (loss) from continuing operations 0.84 4.56 (0.09)1)
Income (loss) from discontinued operations 3.51 (0.13) −1)
Net income (loss) attributable to stockholders 4.35 4.43 (0.09)1)
In 2008, 2007 and 2006, respectively 48 million, 27 million and 19 million securities that could potentially dilute basic EPS were not included in the computation
of dilutive EPS because the effect would have been antidilutive for the periods presented.
In 2008, the incremental shares from assumed conversion are not taken into account as the effect would be antidilutive.
1)
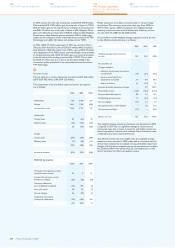
45
Receivables
The accounts receivable, net, split per sector are as follows:
2007 2008
Healthcare 1,425 1,586
Consumer Lifestyle 1,770 1,258
Lighting 796 851
I&EB 151 85
GM&S 67 33
4,209 3,813
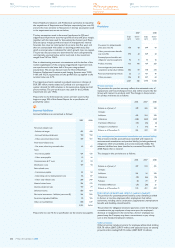
The ageing analysis of accounts receivable, net, is set out below:
2007 2008
not overdue 3,453 2,953
overdue 1-30 days 495 479
overdue 31-180 days 261 321
overdue > 180 days −60
4,209 3,813
A large part of the overdues of trade accounts receivable relates to
public sector customers with slow payment approval processes.
Provisions primarily relate to items overdue for more than 180 days.
Income taxes receivable (current portion) totaling EUR 133 million
(2007: EUR 52 million) are included in other receivables.
The changes in the allowance for doubtful accounts receivable
are as follows:
2006 2007 2008
Balance as of January 1 369 336 300
Additions charged to income 52 62 33
Deductions from allowance1) (72) (85) (63)
Other movements2) (13) (13) 10
Balance as of December 31 336 300 280
Write-offs for which an allowance was previously provided
1)
Including the effect of translation differences and consolidation changes
2)
46
Inventories
Inventories are summarized as follows:
2007 2008
Raw materials and supplies 908 976
Work in process 391 530
Finished goods 1,968 2,066
Advance payments on work in process (121) (201)
3,146 3,371
The amounts recorded above are net of allowances for obsolescence.
As of December 31, 2008, the carrying amount of inventories carried
at fair value less cost-to-sell is EUR 257 million (2007: EUR 190 million).
Philips Annual Report 2008228
180
Sustainability performance
244
Company financial statements
124
US GAAP financial statements
192
IFRS financial statements
Notes to the IFRS financial
statements