Philips 2008 Annual Report Download - page 222
Download and view the complete annual report
Please find page 222 of the 2008 Philips annual report below. You can navigate through the pages in the report by either clicking on the pages listed below, or by using the keyword search tool below to find specific information within the annual report.-
 1
1 -
2
-
3
-
4
-
5
-
6
-
7
-
8
-
9
-
10
-
11
-
12
-
13
-
14
-
15
-
16
-
17
-
18
-
19
-
20
-
21
-
22
-
23
-
24
-
25
-
26
-
27
-
28
-
29
-
30
-
31
-
32
-
33
-
34
-
35
-
36
-
37
-
38
-
39
-
40
-
41
-
42
-
43
-
44
-
45
-
46
-
47
-
48
-
49
-
50
-
51
-
52
-
53
-
54
-
55
-
56
-
57
-
58
-
59
-
60
-
61
-
62
-
63
-
64
-
65
-
66
-
67
-
68
-
69
-
70
-
71
-
72
-
73
-
74
-
75
-
76
-
77
-
78
-
79
-
80
-
81
-
82
-
83
-
84
-
85
-
86
-
87
-
88
-
89
-
90
-
91
-
92
-
93
-
94
-
95
-
96
-
97
-
98
-
99
-
100
-
101
-
102
-
103
-
104
-
105
-
106
-
107
-
108
-
109
-
110
-
111
-
112
-
113
-
114
-
115
-
116
-
117
-
118
-
119
-
120
-
121
-
122
-
123
-
124
-
125
-
126
-
127
-
128
-
129
-
130
-
131
-
132
-
133
-
134
-
135
-
136
-
137
-
138
-
139
-
140
-
141
-
142
-
143
-
144
-
145
-
146
-
147
-
148
-
149
-
150
-
151
-
152
-
153
-
154
-
155
-
156
-
157
-
158
-
159
-
160
-
161
-
162
-
163
-
164
-
165
-
166
-
167
-
168
-
169
-
170
-
171
-
172
-
173
-
174
-
175
-
176
-
177
-
178
-
179
-
180
-
181
-
182
-
183
-
184
-
185
-
186
-
187
-
188
-
189
-
190
-
191
-
192
-
193
-
194
-
195
-
196
-
197
-
198
-
199
-
200
-
201
-
202
-
203
-
204
-
205
-
206
-
207
-
208
-
209
-
210
-
211
-
 212
212 -
 213
213 -
 214
214 -
 215
215 -
 216
216 -
 217
217 -
 218
218 -
 219
219 -
 220
220 -
 221
221 -
 222
222 -
 223
223 -
 224
224 -
 225
225 -
 226
226 -
 227
227 -
 228
228 -
 229
229 -
 230
230 -
 231
231 -
 232
232 -
233
-
234
-
235
-
236
-
237
-
238
-
239
-
240
-
241
-
242
-
243
-
244
-
245
-
246
-
247
-
248
-
249
-
250
-
251
-
252
-
253
-
254
-
255
-
256
-
257
-
258
-
259
-
260
-
261
-
262
-
263
-
264
-
265
-
266
-
267
-
268
-
269
-
270
-
271
-
272
-
273
-
274
-
275
-
276
 |
 |

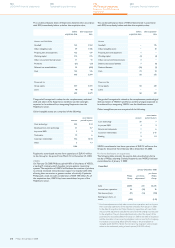
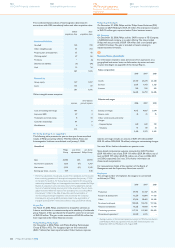
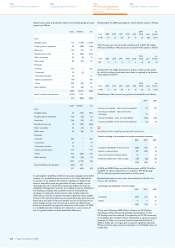
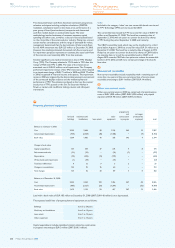
The condensed balance sheet of Intermagnetics determined in
accordance with IFRS, immediately before and after acquisition date:
before
acquisition date
after
acquisition date
Assets and liabilities
Goodwill 132 730
Other intangible assets 34 313
Property, plant and equipment 35 45
Working capital 67 66
Provisions −(6)
Deferred tax liabilities (6) (96)
Cash 19 24
281 1,076
Financed by
Group equity 137 1,017
Loans 144 59
281 1,076
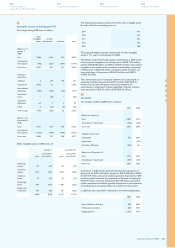
Other intangible assets comprise:
amount
amortization
period in years
Core and existing technology 181 6
In-process R&D 39 3
Trademarks and trade names 8 10
Customer relationships 81 9
Miscellaneous 4 2
313
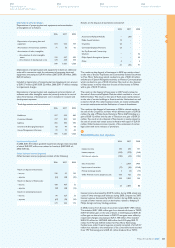
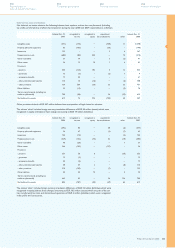
Pro forma disclosures on acquisitions
The following table presents the year-to-date pro forma unaudited
results of Philips, assuming Lifeline, Witt Biomedical, Avent and
Intermagnetics had been consolidated as of January 1, 2006:
Unaudited
Philips
Group
pro forma
adjustments1)
pro forma
Philips Group
Sales 26,682 236 26,918
Income from operations 1,336 (17) 1,319
Net income 5,153 (11) 5,142
Earnings per share - in euros
4.39 4.38
Pro forma adjustments include sales, income from operations and net income
1)
from continuing operations of the acquired companies from January 1, 2006
to the date of acquisition. For that purpose, sales related to the pre-existing
relationship between Philips and Intermagnetics have been excluded. As Philips
finances its acquisitions with own funds, the pro forma adjustments exclude
the cost of external funding incurred prior to the acquisition. The pro forma
adjustments also reflect the impact of the purchase-price accounting effects
from January 1, 2006 to the date of acquisition and the elimination of
non-recurring post-merger integration costs incurred by the Company.
Purchase-price accounting effects primarily relate to the amortization of
intangible assets (EUR 81 million) and inventory step-ups (EUR 24 million).
CryptoTec
On March 31, 2006, Philips transferred its CryptoTec activities to
Irdeto, a world leader in content security and a subsidiary of multimedia
group Naspers. Irdeto purchased the CryptoTec assets for an amount
of EUR 30 million. The gain on this transaction of EUR 26 million has
been reported under Other Business income.
Philips Enabling Technologies
On November 6, 2006, Philips sold Philips Enabling Technologies
Group (ETG) to VDL. The recognized gain on this transaction
(EUR 7 million) has been reported under Other business expense.
Philips Sound Solutions
On December 31, 2006, Philips sold its Philips Sound Solutions (PSS)
business to D&M Holding for EUR 53 million. The transaction resulted
in EUR 12 million gain, reported under Other business income.
FEI Company
On December 20, 2006, Philips sold its 24.8% interest in FEI Company,
a NASDAQ listed company, in a public offering. The sale provided
Philips with net proceeds of EUR 154 million and a non-taxable gain
of EUR 103 million. The gain is included in Results relating to
equity-accounted investees.
40
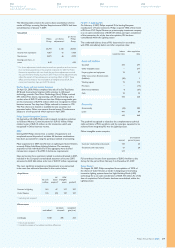
Income from operations
For information related to sales and income from operations on a
geographical and sector basis, see Information by sector and main
country that begins on page 206 of this Annual Report.
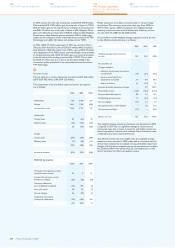
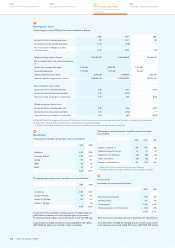
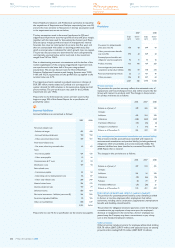
Sales composition
2006 2007 2008
Goods 24,107 24,270 23,568
Services 2,073 1,973 2,325
Licenses 502 550 492
26,682 26,793 26,385
Salaries and wages
2006 2007 2008
Salaries and wages 4,613 4,607 5,094
Pension costs 76 41 75
Other social security and similar
charges:
- Required by law 640 642 749
- Voluntary 91 89 63
5,420 5,379 5,981
Salaries and wages include an amount of EUR 372 million (2007:
EUR 35 million, 2006: EUR 78 million) relating to restructuring charges.
See note 56 for further information on pension costs.
Share-based compensation expense amounted to EUR 78 million
(EUR 106 million, net of tax), EUR 111 million (EUR 84 million, net of
tax) and EUR 107 million (EUR 78 million, net of tax) in 2008, 2007,
and 2006, respectively. See note 33 for futher information on
share-based compensation.
For remuneration details of the members of the Board of
Management and the Supervisory Board, see note 34.
Employees
The average number of employees by category is summarized
as follows (in FTEs):
2006 2007 2008
Production 59,955 61,447 66,675
Research & development 13,227 12,804 11,926
Other 27,694 28,469 34,365
Permanent employees 100,876 102,720 112,966
Temporary employees 16,225 16,660 13,493
Continuing operations 117,101 119,380 126,459
Discontinued operations1) 44,040 6,276 −
Average number of discontinued operations relates to MDS, Semiconductors
1)
and MedQuist. MDS was reported until June 2007, Semiconductors until
September 2007 and MedQuist until August 2008
Philips Annual Report 2008222
180
Sustainability performance
244
Company financial statements
124
US GAAP financial statements
192
IFRS financial statements
Notes to the IFRS financial
statements