Philips 2008 Annual Report Download - page 48
Download and view the complete annual report
Please find page 48 of the 2008 Philips annual report below. You can navigate through the pages in the report by either clicking on the pages listed below, or by using the keyword search tool below to find specific information within the annual report.-
 1
1 -
2
-
3
-
4
-
5
-
6
-
7
-
8
-
9
-
10
-
11
-
12
-
13
-
14
-
15
-
16
-
17
-
18
-
19
-
20
-
21
-
22
-
23
-
24
-
25
-
26
-
27
-
28
-
29
-
30
-
31
-
32
-
33
-
34
-
35
-
36
-
37
-
 38
38 -
 39
39 -
 40
40 -
 41
41 -
 42
42 -
 43
43 -
 44
44 -
 45
45 -
 46
46 -
 47
47 -
 48
48 -
 49
49 -
 50
50 -
 51
51 -
 52
52 -
 53
53 -
 54
54 -
 55
55 -
 56
56 -
 57
57 -
 58
58 -
59
-
60
-
61
-
62
-
63
-
64
-
65
-
66
-
67
-
68
-
69
-
70
-
71
-
72
-
73
-
74
-
75
-
76
-
77
-
78
-
79
-
80
-
81
-
82
-
83
-
84
-
85
-
86
-
87
-
88
-
89
-
90
-
91
-
92
-
93
-
94
-
95
-
96
-
97
-
98
-
99
-
100
-
101
-
102
-
103
-
104
-
105
-
106
-
107
-
108
-
109
-
110
-
111
-
112
-
113
-
114
-
115
-
116
-
117
-
118
-
119
-
120
-
121
-
122
-
123
-
124
-
125
-
126
-
127
-
128
-
129
-
130
-
131
-
132
-
133
-
134
-
135
-
136
-
137
-
138
-
139
-
140
-
141
-
142
-
143
-
144
-
145
-
146
-
147
-
148
-
149
-
150
-
151
-
152
-
153
-
154
-
155
-
156
-
157
-
158
-
159
-
160
-
161
-
162
-
163
-
164
-
165
-
166
-
167
-
168
-
169
-
170
-
171
-
172
-
173
-
174
-
175
-
176
-
177
-
178
-
179
-
180
-
181
-
182
-
183
-
184
-
185
-
186
-
187
-
188
-
189
-
190
-
191
-
192
-
193
-
194
-
195
-
196
-
197
-
198
-
199
-
200
-
201
-
202
-
203
-
204
-
205
-
206
-
207
-
208
-
209
-
210
-
211
-
212
-
213
-
214
-
215
-
216
-
217
-
218
-
219
-
220
-
221
-
222
-
223
-
224
-
225
-
226
-
227
-
228
-
229
-
230
-
231
-
232
-
233
-
234
-
235
-
236
-
237
-
238
-
239
-
240
-
241
-
242
-
243
-
244
-
245
-
246
-
247
-
248
-
249
-
250
-
251
-
252
-
253
-
254
-
255
-
256
-
257
-
258
-
259
-
260
-
261
-
262
-
263
-
264
-
265
-
266
-
267
-
268
-
269
-
270
-
271
-
272
-
273
-
274
-
275
-
276
 |
 |

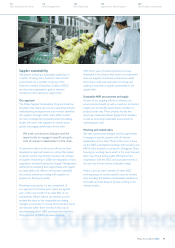
Other restructuring projects included the restructuring
of Assembléon within Innovation & Emerging Businesses
and smaller projects at Group & Management Services.
The most significant restructuring projects in 2007
were related to the Lighting sector and consisted
mainly of the exit from the fluorescent lamp-based
LCD backlighting business and several projects in the
Lamps business.
For further details of restructuring charges, see note
4 of the US GAAP financial statements.
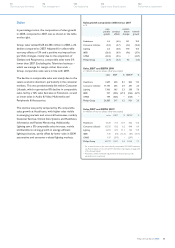
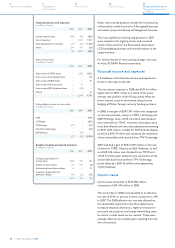
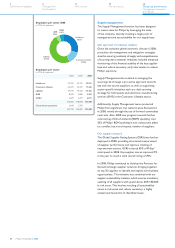
Financial income and expenses
A breakdown of the financial income and expenses is
shown in the table on the left.
The net interest expense in 2008 was EUR 63 million
higher than in 2007, mainly as a result of the lower
average cash position of the Group, partly offset by
lower interest costs on derivatives related to the
hedging of Philips’ foreign currency funding positions.
In 2008, a total gain of EUR 1,197 million was recognized
on the sale of stakes, mainly in TSMC, LG Display and
D&M Holdings. Also, a EUR 23 million cash dividend
was received from TSMC. However, these gains were
more than offset by non-cash value adjustments amounting
to EUR 1,296 million, notably for NXP and LG Display,
as well as a EUR 37 million loss related to the revaluation
of the convertible bond received from TPV Technology.
2007 included a gain of EUR 2,549 million on the sale
of shares in TSMC, Nuance and JDS Uniphase, as well
as a EUR 128 million cash dividend from TSMC and
a EUR 12 million gain related to the revaluation of the
convertible bond received from TPV Technology,
partly offset by a EUR 36 million value adjustment
of JDS Uniphase.
Income taxes
Income taxes amounted to EUR 286 million,
compared to EUR 619 million in 2007.
The tax burden in 2008 corresponded to an effective
tax rate of 311% on pre-tax income, compared to 14%
in 2007. The 2008 effective tax rate was affected by
non-deductible impairment and value adjustments,
increased valuation allowances, higher provisions for
uncertain tax positions and foreign withholding taxes
for which a credit could not be realized. These were
partially offset by non-taxable gains resulting from the
sale of securities.
Financial income and expenses
in millions of euros
2006 2007 2008
Interest expense (net) (189) (43) (106)
Sale of securities −2,549 1,197
Value adjustments on securities (77) (36) (1,296)
Other 294 143 (20)
28 2,613 (225)
Sale of securities
in millions of euros
2006 2007 2008
Gain on sale of TSMC shares −2,528 1,082
Gain on sale of LG Display shares −−83
Gain on sale of D&M shares −−16
Gain on sale of Nuance shares −31 −
Loss on sale of JDS Uniphase shares −(10) −
Others −−16
−2,549 1,197
Value adjustments on securities
in millions of euros
2006 2007 2008
NXP −−(599)
LG Display −−(596)
TPO Display (77) −(71)
Pace Micro Technology −−(30)
JDS Uniphase −(36) −
(77) (36) (1,296)
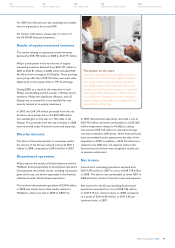
Results of equity-accounted investees
in millions of euros
2006 2007 2008
Company’s participation in
income (loss) (180) 271 81
Results on sale of shares 79 514 (2)
Gains arising from dilution effects 14 −12
Investment impairment and
guarantee charges (70) (22) (72)
(157) 763 19
Philips Annual Report 200848
42
Our group performance
Management discussion
and analysis
18
We care about...
8
Message from
the President
6
Performance highlights
14
Who we are