Philips 2008 Annual Report Download - page 43
Download and view the complete annual report
Please find page 43 of the 2008 Philips annual report below. You can navigate through the pages in the report by either clicking on the pages listed below, or by using the keyword search tool below to find specific information within the annual report.-
 1
1 -
2
-
3
-
4
-
5
-
6
-
7
-
8
-
9
-
10
-
11
-
12
-
13
-
14
-
15
-
16
-
17
-
18
-
19
-
20
-
21
-
22
-
23
-
24
-
25
-
26
-
27
-
28
-
29
-
30
-
31
-
32
-
 33
33 -
 34
34 -
 35
35 -
 36
36 -
 37
37 -
 38
38 -
 39
39 -
 40
40 -
 41
41 -
 42
42 -
 43
43 -
 44
44 -
 45
45 -
 46
46 -
 47
47 -
 48
48 -
 49
49 -
 50
50 -
 51
51 -
 52
52 -
 53
53 -
54
-
55
-
56
-
57
-
58
-
59
-
60
-
61
-
62
-
63
-
64
-
65
-
66
-
67
-
68
-
69
-
70
-
71
-
72
-
73
-
74
-
75
-
76
-
77
-
78
-
79
-
80
-
81
-
82
-
83
-
84
-
85
-
86
-
87
-
88
-
89
-
90
-
91
-
92
-
93
-
94
-
95
-
96
-
97
-
98
-
99
-
100
-
101
-
102
-
103
-
104
-
105
-
106
-
107
-
108
-
109
-
110
-
111
-
112
-
113
-
114
-
115
-
116
-
117
-
118
-
119
-
120
-
121
-
122
-
123
-
124
-
125
-
126
-
127
-
128
-
129
-
130
-
131
-
132
-
133
-
134
-
135
-
136
-
137
-
138
-
139
-
140
-
141
-
142
-
143
-
144
-
145
-
146
-
147
-
148
-
149
-
150
-
151
-
152
-
153
-
154
-
155
-
156
-
157
-
158
-
159
-
160
-
161
-
162
-
163
-
164
-
165
-
166
-
167
-
168
-
169
-
170
-
171
-
172
-
173
-
174
-
175
-
176
-
177
-
178
-
179
-
180
-
181
-
182
-
183
-
184
-
185
-
186
-
187
-
188
-
189
-
190
-
191
-
192
-
193
-
194
-
195
-
196
-
197
-
198
-
199
-
200
-
201
-
202
-
203
-
204
-
205
-
206
-
207
-
208
-
209
-
210
-
211
-
212
-
213
-
214
-
215
-
216
-
217
-
218
-
219
-
220
-
221
-
222
-
223
-
224
-
225
-
226
-
227
-
228
-
229
-
230
-
231
-
232
-
233
-
234
-
235
-
236
-
237
-
238
-
239
-
240
-
241
-
242
-
243
-
244
-
245
-
246
-
247
-
248
-
249
-
250
-
251
-
252
-
253
-
254
-
255
-
256
-
257
-
258
-
259
-
260
-
261
-
262
-
263
-
264
-
265
-
266
-
267
-
268
-
269
-
270
-
271
-
272
-
273
-
274
-
275
-
276
 |
 |

Management
discussion and
analysis
Management summary
The year 2008…
2008 was impacted by the most globally significant •
economic downturn in many years. For Philips, this
led to a 3% decline in comparable sales and lower
earnings. In response, we proactively expanded and
accelerated restructuring programs across all sectors
and stepped up our focus on costs and cash management.
2008 was nevertheless a year of strategic progress. •
We continued the reshaping of our portfolio by
investing EUR 5.3 billion in high-growth, high-margin
businesses such as Respironics and Genlyte, and
divesting unprofitable activities such as Television
in North America and non-core businesses such as
Set-Top Boxes and PC Monitors.
Healthcare sales grew by 6% on a comparable basis;
•
all businesses contributed to this growth. Lighting
achieved 3% comparable sales growth, driven by
energy-efficient lighting solutions. Consumer Lifestyle
sales on a comparable basis, declined 8% compared
to 2007, reflecting the severe economic downturn in
consumer markets in the second half of 2008.
Emerging markets remained a major focal point and
•
delivered 4% comparable growth in 2008 – with
Healthcare and Lighting growing by 12% and 8%
respectively. Additionally, we announced and/or
finalized five strategic Healthcare acquisitions in
China, Brazil and India.
EBIT included EUR 1.1 billion of charges related to •
restructuring and change programs across all sectors
(EUR 520 million), an asbestos-related settlement
charge (EUR 239 million), a non-cash goodwill
impairment charge for Lumileds (EUR 232 million)
and acquisition-related charges, mainly in Healthcare
and Lighting (EUR 146 million), which were partially
offset by EUR 164 million of gains on the sale of
businesses and real estate.
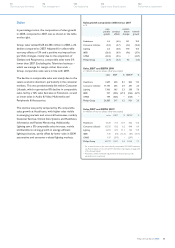
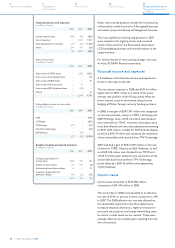
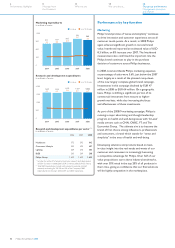
Key data
in millions of euros unless otherwise stated
20061) 20071) 2008
Sales 26,682 26,793 26,385
EBITA2) 1,383 2,054 931
as a % of sales 5.2 7.7 3.5
EBIT 1,198 1,841 317
as a % of sales 4.5 6.9 1.2
Financial income and expenses 28 2,613 (225)
Income tax expense (166) (619) (286)
Results of equity-accounted
investees (157) 763 19
Minority interests (4 ) (5) (3 )
Income (loss) from continuing
operations 899 4,593 (178 )
Income (loss) from discontinued
operations 4,482 (433) (8 )
Net income (loss) 5,381 4,160 (186)
Per common share - basic 4.58 3.83 (0.19)
Per common share - diluted 4.55 3.79 (0.19)
Net operating capital (NOC)2) 8,473 10,529 14,867
Cash flows before financing
activities (2,472 ) 5,449 (1,606)
Employees (FTEs) 121,732 123,801 121,398
of which discontinued
operations 6,640 5,703 −
Revised to reflect immaterial adjustments of intercompany profit
1)
eliminations on inventories
For a reconciliation to the most directly comparable US GAAP measures,
2)
see Reconciliation of non-US GAAP information that begins on page
250 of this Annual Report
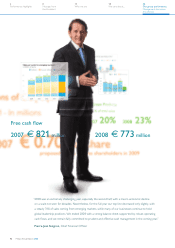
We generated strong cash flows from operations
•
of EUR 1,495 million despite lower earnings, driven
by rigorous working capital management. In addition,
in March we structurally refinanced our debt – prior
to the collapse of the financial markets – providing
Philips with a strong balance sheet and a solid
liquidity position to help weather the turbulent
economic situation.
We reduced our shareholding in LG Display and •
sold our remaining stake in TSMC, generating
EUR 2.5 billion in cash proceeds and realizing a gain
of just under EUR 1.2 billion. The economic downturn
led us to take a non-cash value adjustment of EUR 1.4
billion on the majority of our remaining financial holdings.
We completed EUR 3.3 billion of the EUR 5 billion •
share buy-back program announced in 2007, which
was subsequently stopped in January 2009 until
further notice. Additionally, we returned EUR 720
million to shareholders in the form of our annual
dividend payment.
Philips Annual Report 2008 43
122
Performance statements
114
Supervisory Board report
110
Our leadership
94
Risk management
70
Our sector performance