Philips 2008 Annual Report Download - page 67
Download and view the complete annual report
Please find page 67 of the 2008 Philips annual report below. You can navigate through the pages in the report by either clicking on the pages listed below, or by using the keyword search tool below to find specific information within the annual report.-
 1
1 -
2
-
3
-
4
-
5
-
6
-
7
-
8
-
9
-
10
-
11
-
12
-
13
-
14
-
15
-
16
-
17
-
18
-
19
-
20
-
21
-
22
-
23
-
24
-
25
-
26
-
27
-
28
-
29
-
30
-
31
-
32
-
33
-
34
-
35
-
36
-
37
-
38
-
39
-
40
-
41
-
42
-
43
-
44
-
45
-
46
-
47
-
48
-
49
-
50
-
51
-
52
-
53
-
54
-
55
-
56
-
 57
57 -
 58
58 -
 59
59 -
 60
60 -
 61
61 -
 62
62 -
 63
63 -
 64
64 -
 65
65 -
 66
66 -
 67
67 -
 68
68 -
 69
69 -
 70
70 -
 71
71 -
 72
72 -
 73
73 -
 74
74 -
 75
75 -
 76
76 -
 77
77 -
78
-
79
-
80
-
81
-
82
-
83
-
84
-
85
-
86
-
87
-
88
-
89
-
90
-
91
-
92
-
93
-
94
-
95
-
96
-
97
-
98
-
99
-
100
-
101
-
102
-
103
-
104
-
105
-
106
-
107
-
108
-
109
-
110
-
111
-
112
-
113
-
114
-
115
-
116
-
117
-
118
-
119
-
120
-
121
-
122
-
123
-
124
-
125
-
126
-
127
-
128
-
129
-
130
-
131
-
132
-
133
-
134
-
135
-
136
-
137
-
138
-
139
-
140
-
141
-
142
-
143
-
144
-
145
-
146
-
147
-
148
-
149
-
150
-
151
-
152
-
153
-
154
-
155
-
156
-
157
-
158
-
159
-
160
-
161
-
162
-
163
-
164
-
165
-
166
-
167
-
168
-
169
-
170
-
171
-
172
-
173
-
174
-
175
-
176
-
177
-
178
-
179
-
180
-
181
-
182
-
183
-
184
-
185
-
186
-
187
-
188
-
189
-
190
-
191
-
192
-
193
-
194
-
195
-
196
-
197
-
198
-
199
-
200
-
201
-
202
-
203
-
204
-
205
-
206
-
207
-
208
-
209
-
210
-
211
-
212
-
213
-
214
-
215
-
216
-
217
-
218
-
219
-
220
-
221
-
222
-
223
-
224
-
225
-
226
-
227
-
228
-
229
-
230
-
231
-
232
-
233
-
234
-
235
-
236
-
237
-
238
-
239
-
240
-
241
-
242
-
243
-
244
-
245
-
246
-
247
-
248
-
249
-
250
-
251
-
252
-
253
-
254
-
255
-
256
-
257
-
258
-
259
-
260
-
261
-
262
-
263
-
264
-
265
-
266
-
267
-
268
-
269
-
270
-
271
-
272
-
273
-
274
-
275
-
276
 |
 |
Supplier performance
We continued to drive progress in our Supplier
Sustainability Involvement Program in 2008. A total
of 572 audits of Bill of Material (BOM) and non-
product related (NPR) identified risk suppliers were
carried out in 2008, comprised of:
244 initial audits of new suppliers, including those
•
from acquisitions, new sites or spend growth
exceeding EUR 100,000
33 continual conformance audits at suppliers audited •
in 2005, and
295 resolution audits focusing on zero-tolerance •
issues (for example: child labor, continual seven-day
work weeks, immediate life-threatening situations,
slave labor conditions and banned substances).
The majority (80%) of BOM-related audits were
conducted in China, where the vast majority of
non-compliances (89%) were found.
2008 supplier audit results
The most frequently identified issues coming out of
the 277 initial and continual conformance audits were
as follows:
Zero-tolerance – emergency preparedness (blocked fire •
exits); occupational safety (immediate threat to health and
safety); working conditions (exposure to hazardous
substances); working hours (continual seven-day work
weeks); and lack of environmental permits.
Limited-tolerance – improper handling/processing of •
chemical waste; working hours (above legal limits/60
hours a week); wages and benefits (below minimum
wages and absence of legal overtime payment);
environmental performance objectives do not meet
legal requirements; lack of industrial hygiene (lack of
personal protective equipment); occupational injury
and illness (no medical treatment facility).
Increased speed of resolution
During 2008 we focused on resolving zero-tolerance
issues, leading to a 60% improvement in resolution
speed. During the last four months of the year all zero-
tolerance issues were resolved within 105 days, down
significantly from the average resolution time of 250
days in 2007. At year-end there were no zero-
tolerance issues older than three months.
The most frequently identified zero-tolerance issues
related to occupational health and safety risks and
continual seven-day work weeks. Health and safety
issues can be resolved quickly. Dealing with working
hours often entails installing extra shifts with additional
personnel, which can take at least a month.
Where no improvement could be established,
25 suppliers were phased out.
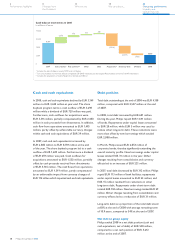
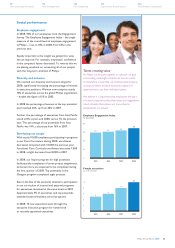
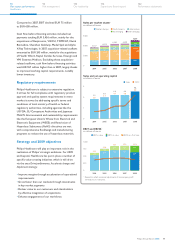
Lost workday injuries
per 100 FTEs
1.00
0.75
0.50
0.25
0
0.78
2005
0.78
2006
0.81
2007
0.68
2008
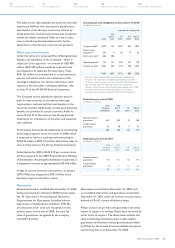
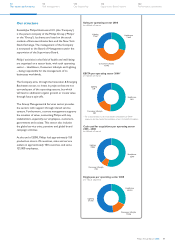
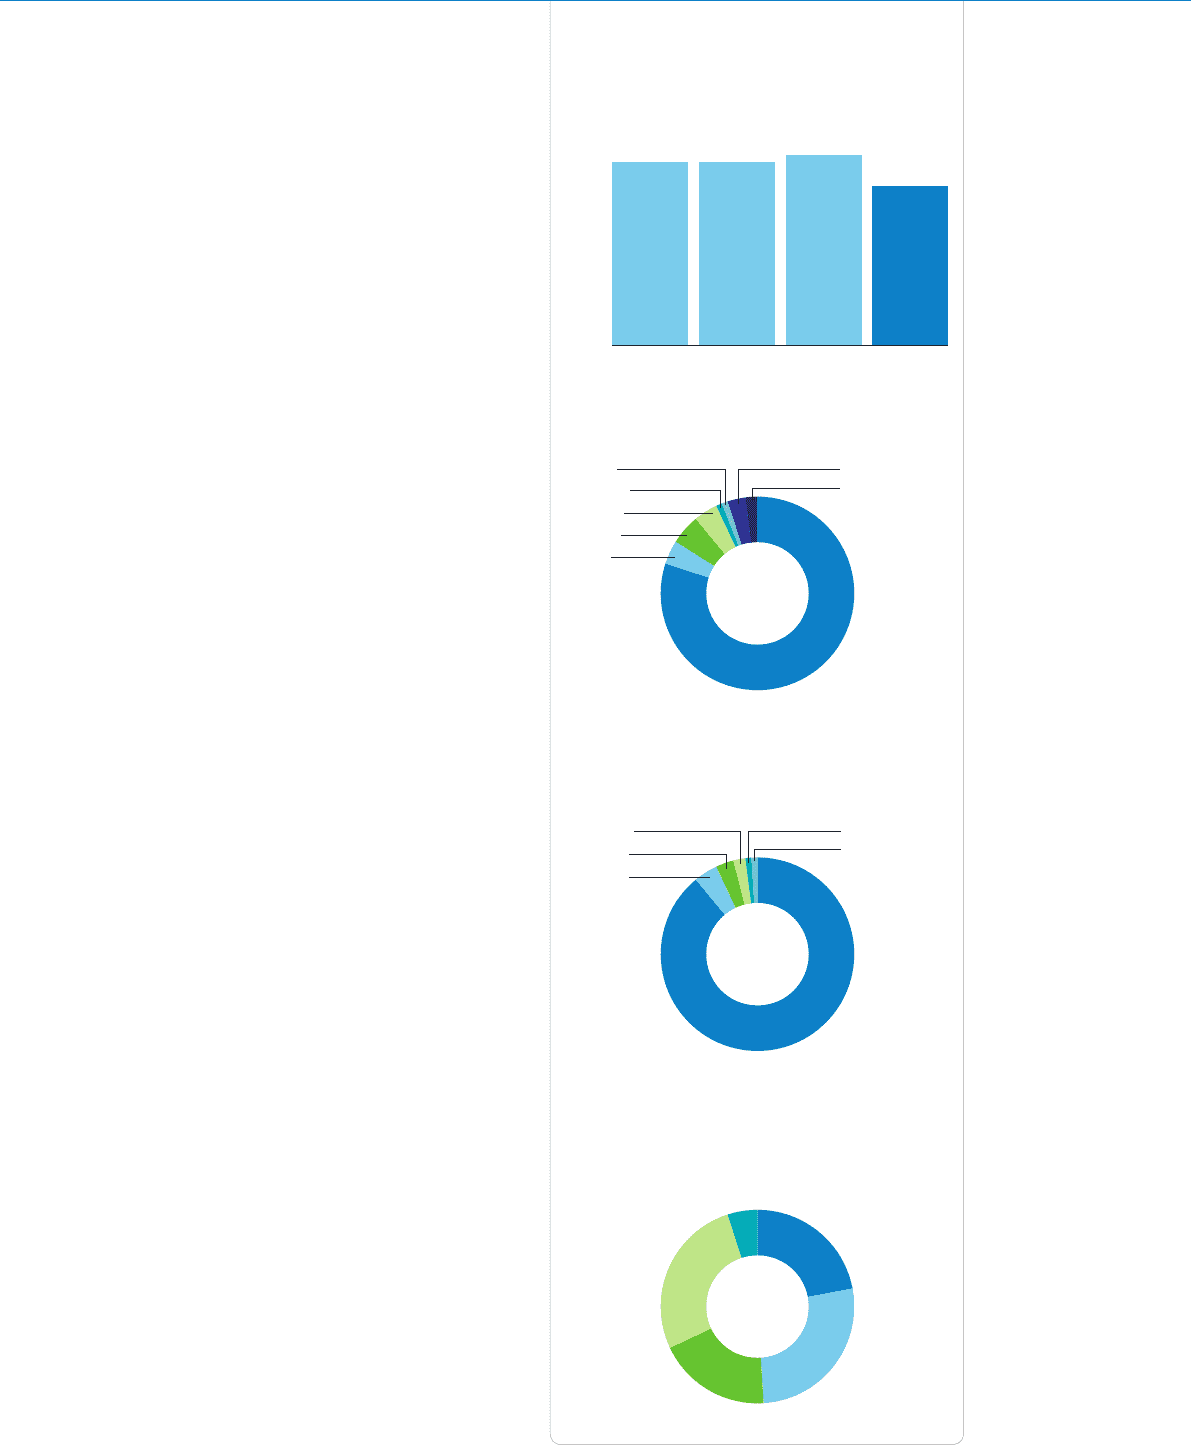
Distribution of supplier audits by country
as a % of BOM-related audits in risk countries
China 80
India 1
Taiwan 3 Others 2
Brazil 4
Mexico 5
Malaysia 4
Indonesia 1
Distribution of non-compliances by country
as a % of BOM-related audits in risk countries
China 89
Taiwan 1
India 1
Mexico 4
Malaysia 3
Indonesia 2
Distribution of non-compliances by grouping
as a % of BOM-related audits in risk countries
Labor
22
Health
and safety
27
Environmental
19
Management system
27
Ethics
5
Philips Annual Report 2008 67
122
Performance statements
114
Supervisory Board report
110
Our leadership
94
Risk management
70
Our sector performance