Philips 2008 Annual Report Download - page 64
Download and view the complete annual report
Please find page 64 of the 2008 Philips annual report below. You can navigate through the pages in the report by either clicking on the pages listed below, or by using the keyword search tool below to find specific information within the annual report.-
 1
1 -
2
-
3
-
4
-
5
-
6
-
7
-
8
-
9
-
10
-
11
-
12
-
13
-
14
-
15
-
16
-
17
-
18
-
19
-
20
-
21
-
22
-
23
-
24
-
25
-
26
-
27
-
28
-
29
-
30
-
31
-
32
-
33
-
34
-
35
-
36
-
37
-
38
-
39
-
40
-
41
-
42
-
43
-
44
-
45
-
46
-
47
-
48
-
49
-
50
-
51
-
52
-
53
-
 54
54 -
 55
55 -
 56
56 -
 57
57 -
 58
58 -
 59
59 -
 60
60 -
 61
61 -
 62
62 -
 63
63 -
 64
64 -
 65
65 -
 66
66 -
 67
67 -
 68
68 -
 69
69 -
 70
70 -
 71
71 -
 72
72 -
 73
73 -
 74
74 -
75
-
76
-
77
-
78
-
79
-
80
-
81
-
82
-
83
-
84
-
85
-
86
-
87
-
88
-
89
-
90
-
91
-
92
-
93
-
94
-
95
-
96
-
97
-
98
-
99
-
100
-
101
-
102
-
103
-
104
-
105
-
106
-
107
-
108
-
109
-
110
-
111
-
112
-
113
-
114
-
115
-
116
-
117
-
118
-
119
-
120
-
121
-
122
-
123
-
124
-
125
-
126
-
127
-
128
-
129
-
130
-
131
-
132
-
133
-
134
-
135
-
136
-
137
-
138
-
139
-
140
-
141
-
142
-
143
-
144
-
145
-
146
-
147
-
148
-
149
-
150
-
151
-
152
-
153
-
154
-
155
-
156
-
157
-
158
-
159
-
160
-
161
-
162
-
163
-
164
-
165
-
166
-
167
-
168
-
169
-
170
-
171
-
172
-
173
-
174
-
175
-
176
-
177
-
178
-
179
-
180
-
181
-
182
-
183
-
184
-
185
-
186
-
187
-
188
-
189
-
190
-
191
-
192
-
193
-
194
-
195
-
196
-
197
-
198
-
199
-
200
-
201
-
202
-
203
-
204
-
205
-
206
-
207
-
208
-
209
-
210
-
211
-
212
-
213
-
214
-
215
-
216
-
217
-
218
-
219
-
220
-
221
-
222
-
223
-
224
-
225
-
226
-
227
-
228
-
229
-
230
-
231
-
232
-
233
-
234
-
235
-
236
-
237
-
238
-
239
-
240
-
241
-
242
-
243
-
244
-
245
-
246
-
247
-
248
-
249
-
250
-
251
-
252
-
253
-
254
-
255
-
256
-
257
-
258
-
259
-
260
-
261
-
262
-
263
-
264
-
265
-
266
-
267
-
268
-
269
-
270
-
271
-
272
-
273
-
274
-
275
-
276
 |
 |

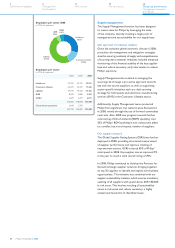
Within Corporate Technologies, Philips Research
invested approximately EUR 41 million, spread over
Green Innovation projects focused on meeting global
challenges related to water, air, waste and energy.
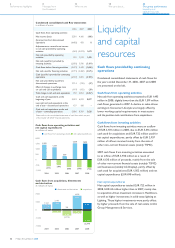
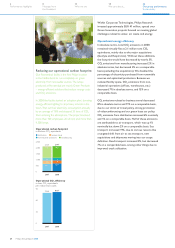
Operational energy efficiency
In absolute terms, total CO2 emissions in 2008
remained virtually flat at 2.1 million tons CO2
equivalents, mainly due to the major acquisitions
(Genlyte and Respironics). Without these additions,
the footprint would have decreased by nearly 5%.
CO2 emissions from manufacturing increased 2% in
absolute terms, but decreased 4% on a comparable
basis (excluding the acquisitions). We doubled the
percentage of electricity purchased from renewable
sources and optimized production. Because we
reduced facility space, CO2 emissions from non-
industrial operations (offices, warehouses, etc.)
decreased 7% in absolute terms, and 15% on a
comparable basis.
CO2 emissions related to business travel decreased
8% in absolute terms and 11% on a comparable basis,
due to our strict air travel policy, strong promotion
of videoconferencing and our green lease car policy.
CO2 emissions from distribution increased 6% nominally
and 1% on a comparable basis. Half of these emissions
are attributable to air transport, which was up 1%
nominally but down 2% on a comparable basis. Sea
transport increased 19%, due to various reasons like
a targeted shift from air to sea transport, new
acquisitions and shipments moving into our scope
definition. Road transport increased 2%, but decreased
7% on a comparable basis, among other things due to
improved truck utilization.
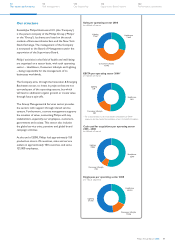
Operational CO2 efficiency
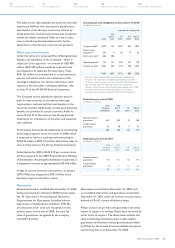
in tons CO2 equivalents
90
60
30
0
79.40
2007
81.37
2008
per million euros sales
Operational carbon footprint
in kilotons CO equivalents
distribution business travel
non-industrial operations manufacturing
2,500
2,000
1,500
1,000
500
0
661
266
260
940
2007
2,127
699
244
242
962
2008
2,147
2
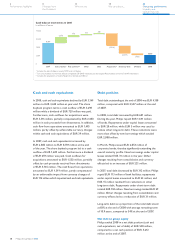
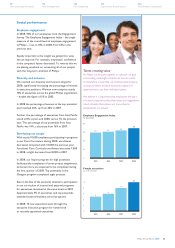
Reducing our operational carbon footprint
Our Roosendaal facility is the first Philips location
in the Netherlands to run completely on green
electricity from renewable sources. The lamps
produced at Roosendaal are mainly Green Products
– energy-efficient solutions that reduce energy costs
and CO2 emissions.
In 2008 the facility started an ‘adoption plan’, donating
energy-efficient lighting to all primary schools in the
town. That cut their electricity consumption annually
by an average of 18% and stopped 33 tons of CO2
from entering the atmosphere. The project involved
more than 100 employees, 26 schools and more than
9,500 lamps.
Philips Annual Report 200864
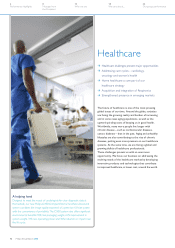
42
Our group performance
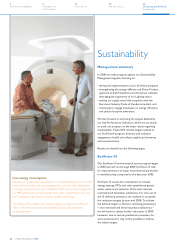
Sustainability
18
We care about...
8
Message from
the President
6
Performance highlights
14
Who we are