Philips 2008 Annual Report Download - page 58
Download and view the complete annual report
Please find page 58 of the 2008 Philips annual report below. You can navigate through the pages in the report by either clicking on the pages listed below, or by using the keyword search tool below to find specific information within the annual report.-
 1
1 -
2
-
3
-
4
-
5
-
6
-
7
-
8
-
9
-
10
-
11
-
12
-
13
-
14
-
15
-
16
-
17
-
18
-
19
-
20
-
21
-
22
-
23
-
24
-
25
-
26
-
27
-
28
-
29
-
30
-
31
-
32
-
33
-
34
-
35
-
36
-
37
-
38
-
39
-
40
-
41
-
42
-
43
-
44
-
45
-
46
-
47
-
 48
48 -
 49
49 -
 50
50 -
 51
51 -
 52
52 -
 53
53 -
 54
54 -
 55
55 -
 56
56 -
 57
57 -
 58
58 -
 59
59 -
 60
60 -
 61
61 -
 62
62 -
 63
63 -
 64
64 -
 65
65 -
 66
66 -
 67
67 -
 68
68 -
69
-
70
-
71
-
72
-
73
-
74
-
75
-
76
-
77
-
78
-
79
-
80
-
81
-
82
-
83
-
84
-
85
-
86
-
87
-
88
-
89
-
90
-
91
-
92
-
93
-
94
-
95
-
96
-
97
-
98
-
99
-
100
-
101
-
102
-
103
-
104
-
105
-
106
-
107
-
108
-
109
-
110
-
111
-
112
-
113
-
114
-
115
-
116
-
117
-
118
-
119
-
120
-
121
-
122
-
123
-
124
-
125
-
126
-
127
-
128
-
129
-
130
-
131
-
132
-
133
-
134
-
135
-
136
-
137
-
138
-
139
-
140
-
141
-
142
-
143
-
144
-
145
-
146
-
147
-
148
-
149
-
150
-
151
-
152
-
153
-
154
-
155
-
156
-
157
-
158
-
159
-
160
-
161
-
162
-
163
-
164
-
165
-
166
-
167
-
168
-
169
-
170
-
171
-
172
-
173
-
174
-
175
-
176
-
177
-
178
-
179
-
180
-
181
-
182
-
183
-
184
-
185
-
186
-
187
-
188
-
189
-
190
-
191
-
192
-
193
-
194
-
195
-
196
-
197
-
198
-
199
-
200
-
201
-
202
-
203
-
204
-
205
-
206
-
207
-
208
-
209
-
210
-
211
-
212
-
213
-
214
-
215
-
216
-
217
-
218
-
219
-
220
-
221
-
222
-
223
-
224
-
225
-
226
-
227
-
228
-
229
-
230
-
231
-
232
-
233
-
234
-
235
-
236
-
237
-
238
-
239
-
240
-
241
-
242
-
243
-
244
-
245
-
246
-
247
-
248
-
249
-
250
-
251
-
252
-
253
-
254
-
255
-
256
-
257
-
258
-
259
-
260
-
261
-
262
-
263
-
264
-
265
-
266
-
267
-
268
-
269
-
270
-
271
-
272
-
273
-
274
-
275
-
276
 |
 |

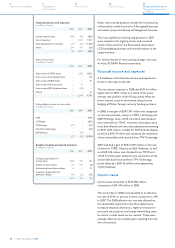
Debt position
Total debt outstanding at the end of 2008 was EUR 4,158
million, compared with EUR 3,557 million at the end
of 2007.
In 2008, total debt increased by EUR 601 million.
During the year, Philips repaid EUR 1,691 million
of bonds. Repayments under capital leases amounted
to EUR 28 million, while EUR 5 million was used to
reduce other long-term debt. These reductions were
more than offset by new borrowings which totaled
EUR 2,088 million.
In March, Philips issued EUR 2,053 million of
corporate bonds, thereby significantly extending the
overall maturity profile. New borrowings under capital
leases totaled EUR 31 million in the year. Other
changes resulting from consolidation and currency
effects led to an increase of EUR 221 million.
In 2007, total debt decreased by EUR 312 million. Philips
repaid EUR 113 million of bank facilities; repayments
under capital leases amounted to EUR 24 million; and
EUR 15 million resulted from reductions in other
long-term debt. Repayments under short-term debt
totaled EUR 158 million. New borrowings totaled EUR 29
million. Other changes resulting from consolidation and
currency effects led to a reduction of EUR 31 million.
Long-term debt as a proportion of the total debt stood
at 83% at the end of 2008 with average remaining term
of 10.9 years, compared to 34% at the end of 2007.
Net debt to group equity
Philips ended 2008 in a net debt position (cash and
cash equivalents, net of debt) of EUR 538 million,
compared to a net cash position of EUR 5,212
million at the end of 2007.
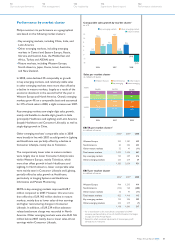
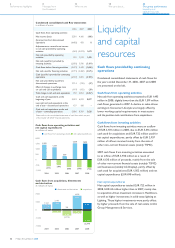
Cash and cash equivalents
In 2008, cash and cash equivalents declined by EUR 5,149
million to EUR 3,620 million at year-end. The share
buyback program led to a cash outflow of EUR 3,298
million while a dividend of EUR 720 million was paid.
Furthermore, cash outflows for acquisitions were
EUR 5,316 million, partially compensated by EUR 2,600
million in cash proceeds from divestments. In addition,
cash flow from operations amounted to EUR 1,495
million, partly offset by unfavorable currency changes
within cash and cash equivalents of EUR 39 million.
In 2007, cash and cash equivalents increased by
EUR 2,883 million to EUR 8,769 million at the end
of the year. The share buyback program led to a cash
outflow of EUR 1,609 million. Furthermore a dividend
of EUR 659 million was paid. Cash outflows for
acquisitions amounted to EUR 1,502 million, partially
offset by cash proceeds received from divestments
of EUR 5,745 million. The cash flows from operations
amounted to EUR 1,519 million, partly compensated
by an unfavorable impact from currency changes of
EUR 112 million which impacted cash and cash equivalents.
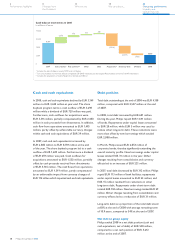
Cash balance movements in 2008
in millions of euros
8,769
2,576 773 415 380
(5,316)
(3,257) (720)
3,620
2007 Sale of stakes1) Free cash flow2) Other Debt Acquisitions3) Share buy-back Dividend 2008
0
14,000
7,000
3,500
10,500
Includes the sale of stakes in mainly TSMC and LG Display
1)
For a reconciliation to the most directly comparable US GAAP measures, see the chapter Reconciliation of non-US GAAP information
2)
Includes the acquisitions of mainly Respironics, Genlyte and VISICU
3)
Philips Annual Report 200858
42
Our group performance
Liquidity and
capital resources
18
We care about...
8
Message from
the President
6
Performance highlights
14
Who we are